1 / 8
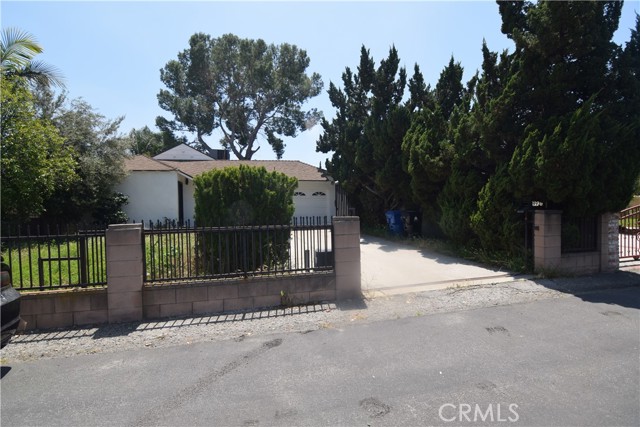
9930 Saticoy Street, Burbank, CA 91504
$875K2bd · 1ba · 862 sqft
Lot 6,753 sqft•Single Family Residence•Active•69d on market•MLS# GD-26186526
9930 Saticoy Street, Burbank, CA 91504
MLS# GD-26186526•Residential•Single Family Residence
Active69 days on market
$875,000
2
Beds
1
Baths
862
Sq Ft
6,753
Lot Sq Ft
1941
Year Built
None
View
Property Description
Conveniently located at the borderline of Burbank and Sun Valley.
Features & Amenities
FeeBuilt 1941
Property Details
Land Type
Fee
Year Built
1941
Property Type
Residential
Property Subtype
Single Family Residence
Parking Spaces
1
Garage Spaces
1
Heating
Combination
Cooling
Central Air
View
None
Flooring
Laminate
Roof
Shingle
City
Burbank
Zip Code
91504
County
Los Angeles
Mortgage Calculator
Current Rates
$
$
%
Monthly Payment
$4,424.48
Principal & Interest
Loan Amount
$700,000
Total Interest
$892,811
Total Payment Over 30 Years
$1,592,811
This calculator provides estimates only. Actual mortgage payments may include taxes, insurance, HOA fees, and PMI. Contact a lender for accurate quotes.
Comparative Market Analysis
Affordable Tier · 5 active · 5 closed
9930 Saticoy Street, Burbank, CA 91504
Burbank · Single Family Residence
$875K
Affordable TierBeds
2
Baths
1
Sqft
862
Lot
6,753 sqft
Year
1941
$/Sqft
$1015
Pool: No✓
Spa: No✓
View: None✓
Garage: 1-car✓
Listed 8.0% above the median closed sale of $810,000. Price per sqft ($1,015) is a 40% premium to closed comps ($725). Closed comps sold at 95% of list — buyers have negotiating leverage.
Price Position
Positioned above the market — commands a premium.
Premium
Subject listed at $875K· $1,015/sqft
Total list price
Closed comps
vs closed median $810K
+$65K (+8.0%)
Active comps
vs active median $839K
+$36K (+4.3%)
Price per sqft
Closed compsinsufficient comp data
Active comps
vs active avg $/sqft $754
+$261 (+34.7%)
Active Properties (5)
Active Comparables
| Address | City | Year | BD | BTH | SqFt | LotSz | LP/SqFt | LP | DIM | Score |
|---|---|---|---|---|---|---|---|---|---|---|
| 10314 Stagg Street | Sun Valley | 1941 | 2 | 1 | 915 | 5,095 | $841 | $769,950 | 7 | 89 |
| 8449 Glencrest Drive | Sun Valley | 1950 | 3 | 1 | 1,134 | 6,050 | $749 | $849,000 | 12 | 73 |
| 6306 Denny Avenue | North Hollywood | 1942 | 2 | 1 | 1,231 | 7,384 | $682 | $839,000 | 31 | 70 |
| 7827 Bakman | Los Angeles | 1954 | 3 | 2 | 1,087 | 6,179 | $726 | $789,000 | 88 | 66 |
| 2109 Lincoln Street | Burbank | 1947 | 3 | 2 | 1,272 | 5,224 | $770 | $979,000 | 107 | 65 |
| Total: 5 · Average | 2.6 | 1.4 | 1,127.8 | 5,986.4 | $753.6 | $845,190 | 49 | |||
| Median | 1,134 | $839,000 | ||||||||
Closed Properties (5)
Closed Comparables
| Address | City | Year | Date | BD | BTH | SqFt | LotSz | LP | SP | SP/SqFt | SP/LP | DIM | Score |
|---|---|---|---|---|---|---|---|---|---|---|---|---|---|
| 10111 Elkwood | Sun Valley | 1943 | 05/29/2026 | 3 | 1 | 1,169 | 6,111 | $824,900 | $810,000 | $693 | 0.98 | 65 | 79 |
| 2711 Lincoln Street | Burbank | 1950 | 06/24/2026 | 3 | 1 | 1,164 | 6,664 | $995,000 | $995,000 | $855 | 1.00 | 13 | 77 |
| 3141 Frederic Street | Burbank | 1950 | 11/21/2025 | 3 | 1 | 1,064 | 6,050 | $1.10M | $952,000 | $895 | 0.86 | 35 | 76 |
| 9929 Saticoy Street | Burbank | 1941 | 02/13/2026 | 2 | 2 | 1,446 | 6,976 | $860,000 | $765,000 | $529 | 0.89 | 198 | 73 |
| 7859 Sancola Avenue | Sun Valley | 1955 | 07/20/2026 | 3 | 2 | 1,220 | 6,923 | $799,990 | $795,000 | $652 | 0.99 | 68 | 71 |
| Total: 5 · Average | 2.8 | 1.4 | 1,212.6 | 6,544.8 | $863,400 | $863,400 | $724.8 | — | 75.8 | ||||
| Median | 1,169 | $810,000 | $810,000 | ||||||||||
Market Analysis
List vs Sale $/SqFt
Sale Price Trend
Days on Market
Sale vs List Price
AI-generated CMA
This analysis was generated automatically from MLS data. For an in-depth, human-reviewed valuation, contact Joseph Sardella at josephsardella@gmail.com.