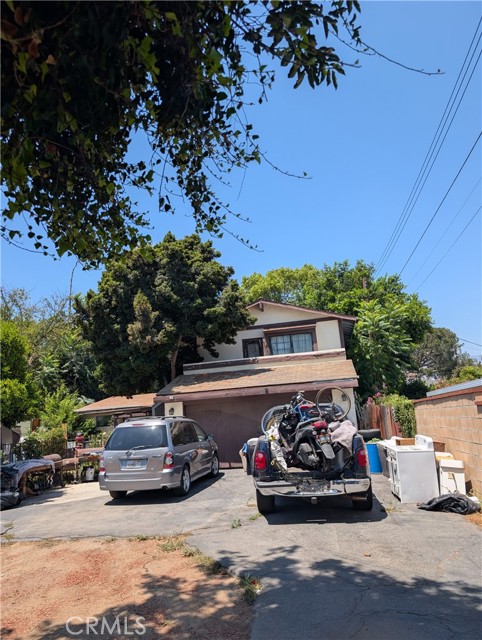
9651 Broadway, Temple City, CA 91780
9651 Broadway, Temple City, CA 91780
Property Description
CALLING ALL BUILDERS! One big lot was legally subdivided years ago. 9651 Broadway, Temple City, Listing #WS26160531. This flag lot is approximately 14,907 sq ft per tax records. The seller just reduced this property by $150,000, therefore reducing the listed price to $1,500,000! The listing agent has not seen the inside of the home, as the seller is selling for land value. The tax records indicate, and the seller describes, the home as such: "The 9651 Broadway home has a 2 Br, 1.5 Ba, 1,508 sqft. inside on a 91.23 x 125 sqft lot. The driveway "pole" of 20' x 172.49' belongs to the 9651 property. Seller says there are 2 bedroom suites, each with bathrooms attached - 3/4 bath with washer/dryer in the bathroom. In addition, another room could be an office/den/hobby room (without a closet). There is a bonus room not connected to the house that was used as a family room". The Broker/Seller is unaware of any permits or lack thereof. The house is "as you see it". That is how the Seller bought the property many years ago. HOME IS IN NEED OF REPAIRS. NOTE: 9647 Broadway, Temple City, Listing #WS26160171 is called the "front home". The front home sits on an approx 12,286 sqft lot. It has a 4 Br, 2 Ba, 2,177 sqft, high-ceiling, two-story home built in 1939 with 2 small basements and a large storage room off the garage. The lot is 71.23' x 172.49' and is listed for $1,363,000. THE HOME IS IN NEED OF MAJOR REPAIRS inside and outside. *Combined front lot and back flag lot total 27,317 approx. sqft = 91.23' x 297.49' could become a beautiful buildable lot in the heart of Temple City, with Temple City Unified School District. The seller ideally wants both lots sold together but is willing to sell them separately. *Both homes that are on the lots need major repairs and have been listed for their land value. * The listing agent has not seen the inside of either home, as their intent is to be sold for land value, so does not guarantee the condition of either home. Buyer(s)/Agent(s) are advised to do their due diligence with all local and/or state authorities regarding zoning and future use of the properties.
Features & Amenities
Property Details
Mortgage Calculator
Current Rates
Comparative Market Analysis
Residential Tier · 5 active · 5 closed
Temple City · Single Family Residence
Listed 10.7% above the median closed sale of $1,355,000. Price per sqft ($995) is a 25% premium to closed comps ($798). Closed comps sold at 103% of list — strong seller's market.
Price Position
Positioned above the market — commands a premium.
Active Properties (5)
Active Comparables
| Address | City | Year | BD | BTH | SqFt | LotSz | LP/SqFt | LP | DIM | Score |
|---|---|---|---|---|---|---|---|---|---|---|
| 9928 Howland | Temple City | 1930 | 3 | 2 | 1,618 | 14,235 | $833 | $1.35M | 13 | 80 |
| 5935 Kauffman Ave. | Temple City | 2026 | 3 | 3 | 1,811 | 8,750 | $707 | $1.28M | 3 | 73 |
| 9647 Broadway | Temple City | 1939 | 4 | 2 | 2,177 | 12,410 | $626 | $1.36M | 101 | 73 |
| 9416 Broadway | Temple City | 1951 | 3 | 2 | 1,359 | 13,046 | $993 | $1.35M | 159 | 71 |
| 5935 Kauffman Ave. | Temple City | 2026 | 4 | 4 | 1,857 | 8,750 | $710 | $1.32M | 134 | 67 |
| Total: 5 · Average | 3.4 | 2.6 | 1,764.4 | 11,438.2 | $773.8 | $1.33M | 82 | |||
| Median | 1,811 | $1.35M | ||||||||
Closed Properties (5)
Closed Comparables
| Address | City | Year | Date | BD | BTH | SqFt | LotSz | LP | SP | SP/SqFt | SP/LP | DIM | Score |
|---|---|---|---|---|---|---|---|---|---|---|---|---|---|
| 9615 La Rosa | Temple City | 1950 | 08/18/2026 | 3 | 2 | 1,730 | 7,054 | $1.35M | $1.35M | $780 | 1.00 | 46 | 82 |
| 5340 Loma Avenue | Temple City | 1954 | 09/24/2026 | 3 | 2 | 1,380 | 14,455 | $1.30M | $1.35M | $982 | 1.04 | 41 | 81 |
| 9959 Garibaldi | Temple City | 1926 | 07/14/2026 | 3 | 3 | 2,076 | 10,707 | $1.39M | $1.38M | $665 | 0.99 | 97 | 76 |
| 5003 Heleo Ave | Temple City | 1949 | 01/26/2026 | 4 | 3 | 1,826 | 7,115 | $1.43M | $1.51M | $827 | 1.06 | 39 | 75 |
| 4903 Ardsley | Temple City | 1948 | 06/23/2026 | 3 | 2 | 1,808 | 6,972 | $1.25M | $1.33M | $736 | 1.06 | 39 | 72 |
| Total: 5 · Average | 3.2 | 2.4 | 1,764 | 9,260.6 | $1.39M | $1.39M | $798 | — | 52.4 | ||||
| Median | 1,808 | $1.35M | $1.35M | ||||||||||
Market Analysis
List vs Sale $/SqFt
Sale Price Trend
Days on Market
Sale vs List Price
This analysis was generated automatically from MLS data. For an in-depth, human-reviewed valuation, contact Joseph Sardella at josephsardella@gmail.com.