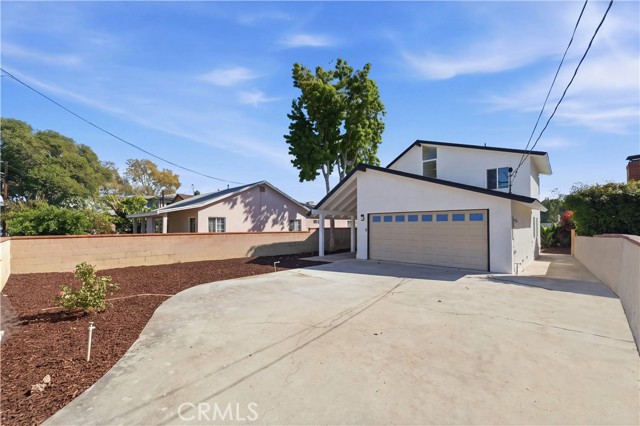
9624 Olive, Temple City, CA 91780
9624 Olive, Temple City, CA 91780
Property Description
Welcome to 9624 Olive Street, newly renovated with a modern warm style in desirable Temple City. Clean lines, understated elegance, and refreshed interiors create a welcoming atmosphere that balances contemporary design with everyday comfort. Whether hosting guests or enjoying a quiet evening at home, this residence offers an inviting setting to make your own. Situated within the highly regarded Temple City Unified School District, the home benefits from a strong educational reputation, including Temple City High School, recognized among the top 5% of public high schools nationwide. Nearby shopping, dining, and neighborhood parks bring added convenience to this established San Gabriel Valley location. A fresh renovation, timeless simplicity, and a sought-after school district make this home a standout opportunity. Schedule your private showing and experience it for yourself.
Features & Amenities
Property Details
Mortgage Calculator
Current Rates
Comparative Market Analysis
Affordable Tier · 5 active · 5 closed
Temple City · Single Family Residence
Listed 6.5% above the median closed sale of $1,080,000. Closed comps sold at 104% of list — strong seller's market. Comparable homes are moving quickly (avg 30 days on market).
Price Position
Positioned above the market — commands a premium.
Active Properties (5)
Active Comparables
| Address | City | Year | BD | BTH | SqFt | LotSz | LP/SqFt | LP | DIM | Score |
|---|---|---|---|---|---|---|---|---|---|---|
| 9650 Olive | Temple City | 1950 | 3 | 3 | 1,680 | 6,295 | $707 | $1.19M | 10 | 90 |
| 5470 Encinita ave | Temple City | 1949 | 4 | 2 | 1,662 | 6,063 | $751 | $1.25M | 33 | 86 |
| 9255 Rio Dell | Rosemead | 1938 | 3 | 2 | 1,504 | 6,486 | $731 | $1.10M | 38 | 83 |
| 9420 Olive St | Temple City | 1920 | 3 | 2 | 1,624 | 9,747 | $768 | $1.25M | 19 | 79 |
| 5113 Glickman Avenue | Temple City | 1960 | 4 | 3 | 1,752 | 6,695 | $678 | $1.19M | 40 | 78 |
| Total: 5 · Average | 3.4 | 2.4 | 1,644.4 | 7,057.2 | $727 | $1.19M | 28 | |||
| Median | 1,662 | $1.19M | ||||||||
Closed Properties (5)
Closed Comparables
| Address | City | Year | Date | BD | BTH | SqFt | LotSz | LP | SP | SP/SqFt | SP/LP | DIM | Score |
|---|---|---|---|---|---|---|---|---|---|---|---|---|---|
| 5135 Kauffman Avenue | Temple City | 1952 | 09/01/2026 | 3 | 2 | 1,520 | 6,957 | $1.17M | $1.24M | $812 | 1.06 | 46 | 93 |
| 5321 Golden West | Temple City | 1965 | 06/24/2026 | 3 | 2 | 1,350 | 6,005 | $1.05M | $1.03M | $763 | 0.98 | 36 | 92 |
| 9735 Broadway | Temple City | 1957 | 05/29/2026 | 3 | 2 | 1,380 | 7,094 | $998,000 | $1.10M | $797 | 1.10 | 37 | 92 |
| 9902 Daines Drive | Temple City | 1952 | 05/18/2026 | 3 | 2 | 1,354 | 6,901 | $1.08M | $1.08M | $798 | 1.00 | 18 | 91 |
| 4924 Kauffman Avenue | Temple City | 1949 | 08/28/2026 | 3 | 2 | 1,332 | 8,334 | $928,800 | $983,000 | $738 | 1.06 | 14 | 90 |
| Total: 5 · Average | 3.0 | 2.0 | 1,387.2 | 7,058.2 | $1.09M | $1.09M | $781.6 | — | 30.2 | ||||
| Median | 1,354 | $1.08M | $1.08M | ||||||||||
Market Analysis
List vs Sale $/SqFt
Sale Price Trend
Days on Market
Sale vs List Price
This analysis was generated automatically from MLS data. For an in-depth, human-reviewed valuation, contact Joseph Sardella at josephsardella@gmail.com.