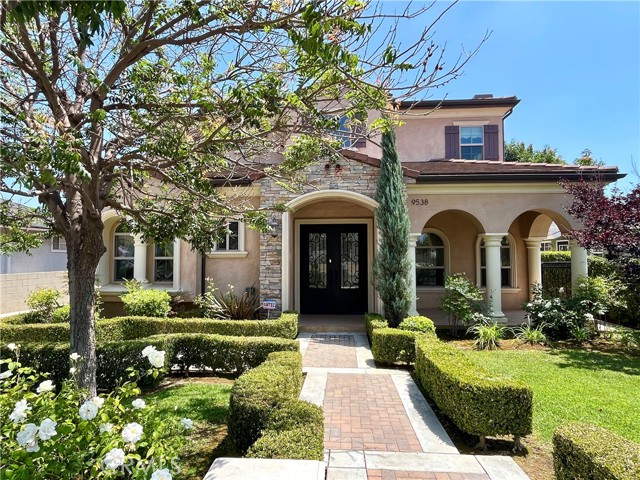
9538 Blackley Street, Temple City, CA 91780
9538 Blackley Street, Temple City, CA 91780
Property Description
Beautiful north facing house located in a quiet street in Temple City with Temple City School. Great location. Close to schools, restaurants and shopping. Easy access to major freeway. House features four bedrooms, four and half bathrooms and library. Total 3041 square feet per builder. One bedroom suite and library downstairs. Other bedrooms including Master bedroom are all suites. Baster bedroom has vaulted ceiling. Marble entrance in the front. Family room and bedrooms are hardwood floor. Kitchen with granite countertops and stainless steel appliances. Shows to appreciate.
Features & Amenities
Property Details
Mortgage Calculator
Current Rates
Comparative Market Analysis
Luxury Tier · 5 active · 5 closed
Temple City · Single Family Residence
Listed 6.8% above the median closed sale of $2,060,000. Price per sqft ($723) is a 10% premium to closed comps ($657). Closed comps sold at 94% of list — buyers have negotiating leverage. Expect a longer timeline — comps averaged 131 days on market. Luxury tier — fewer comparable sales widen the confidence range.
Price Position
Positioned above the market — commands a premium.
Active Properties (5)
Active Comparables
| Address | City | Year | BD | BTH | SqFt | LotSz | LP/SqFt | LP | DIM | Score |
|---|---|---|---|---|---|---|---|---|---|---|
| 5411 Baldwin Avenue | Temple City | 2026 | 5 | 5 | 3,332 | 8,916 | $657 | $2.19M | 11 | 85 |
| 5020 Temple City Boulevard | Temple City | 2019 | 5 | 6 | 3,495 | 10,181 | $624 | $2.18M | 9 | 83 |
| 5762 Loma Avenue | Temple City | 2014 | 4 | 5 | 3,515 | 9,319 | $663 | $2.33M | 47 | 83 |
| 5409 Baldwin Avenue | Temple City | 2026 | 4 | 5 | 3,607 | 11,372 | $662 | $2.39M | 11 | 78 |
| 4905 Baldwin Avenue | Temple City | 1935 | 5 | 4 | 3,517 | 18,158 | $534 | $1.88M | 7 | 54 |
| Total: 5 · Average | 4.6 | 5.0 | 3,493.2 | 11,589.2 | $628 | $2.19M | 17 | |||
| Median | 3,515 | $2.19M | ||||||||
Closed Properties (5)
Closed Comparables
| Address | City | Year | Date | BD | BTH | SqFt | LotSz | LP | SP | SP/SqFt | SP/LP | DIM | Score |
|---|---|---|---|---|---|---|---|---|---|---|---|---|---|
| 5731 Oak Avenue | Temple City | 1934 | 10/16/2026 | 5 | 5 | 2,880 | 9,250 | $2.09M | $1.95M | $677 | 0.93 | 213 | 83 |
| 9429 La Rosa Drive | Temple City | 2017 | 02/13/2026 | 4 | 5 | 2,988 | 7,336 | $1.90M | $1.97M | $658 | 1.03 | 58 | 82 |
| 4922 Heleo Avenue | Temple City | 2021 | 09/01/2026 | 4 | 5 | 3,319 | 12,210 | $2.18M | $2.06M | $621 | 0.94 | 75 | 80 |
| 5329 Alessandro | Temple City | 2023 | 12/22/2025 | 5 | 6 | 3,680 | 9,605 | $2.59M | $2.45M | $666 | 0.95 | 50 | 80 |
| 5305 Glickman Avenue | Temple City | 2025 | 02/12/2026 | 4 | 5 | 3,698 | 10,012 | $2.89M | $2.45M | $663 | 0.85 | 259 | 76 |
| Total: 5 · Average | 4.4 | 5.2 | 3,313 | 9,682.6 | $2.17M | $2.17M | $657 | — | 131 | ||||
| Median | 3,319 | $2.06M | $2.06M | ||||||||||
Market Analysis
List vs Sale $/SqFt
Sale Price Trend
Days on Market
Sale vs List Price
This analysis was generated automatically from MLS data. For an in-depth, human-reviewed valuation, contact Joseph Sardella at josephsardella@gmail.com.