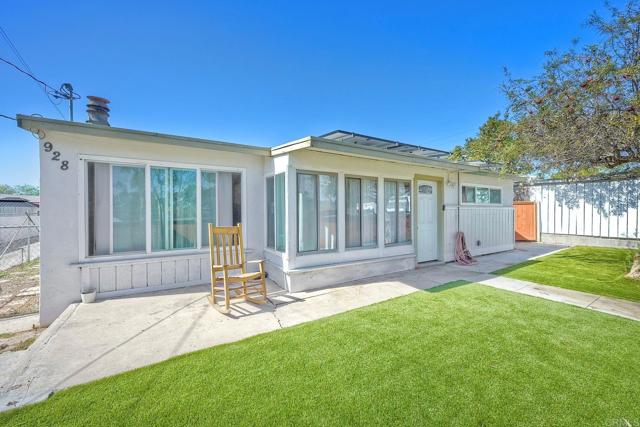
928 42nd Street, San Diego, CA 92102
928 42nd Street, San Diego, CA 92102
Property Description
Welcome to this charming, detached 3-bedroom, 1-bathroom home updated for modern, eco-friendly living. The property is equipped with a solar power system (buyer to assume lease) and a Tesla backup battery, offering excellent energy efficiency. Step outside to a private, fully fenced yard featuring premium, low-maintenance artificial turf alongside a mature, producing pomegranate tree. This move-in-ready residence also includes a separate laundry room. Located just minutes from downtown San Diego, Balboa Park, and Petco Park with rapid access to the I-15, I-5, and I-94 freeways. There is a Costco 1.5 miles away!
Features & Amenities
Property Details
Mortgage Calculator
Current Rates
Comparative Market Analysis
Affordable Tier · 5 active · 5 closed
San Diego · Single Family Residence
Listed 5.3% above the median closed sale of $655,000.
Price Position
Positioned above the market — commands a premium.
Active Properties (5)
Active Comparables
| Address | City | Year | BD | BTH | SqFt | LotSz | LP/SqFt | LP | DIM | Score |
|---|---|---|---|---|---|---|---|---|---|---|
| 1014 40th st | San Diego | 1958 | 3 | 1 | 912 | 4,400 | $746 | $679,999 | 35 | 92 |
| 4008 Manzanita Drive | San Diego | 1965 | 3 | 2 | 896 | 6,321 | $865 | $775,000 | 30 | 77 |
| 264 39th Street | San Diego | 1925 | 2 | 2 | 736 | 2,943 | $849 | $625,000 | 6 | 76 |
| 4156 Franklin Avenue | San Diego | 1958 | 4 | 2 | 1,158 | 3,269 | $656 | $760,000 | 26 | 76 |
| 3170 L Street | San Diego | 2026 | 2 | 2 | 797 | 1,392 | $847 | $675,000 | 34 | 71 |
| Total: 5 · Average | 2.8 | 1.8 | 899.8 | 3,665 | $792.6 | $702,999.8 | 26.2 | |||
| Median | 896 | $679,999 | ||||||||
Closed Properties (5)
Closed Comparables
| Address | City | Year | Date | BD | BTH | SqFt | LotSz | LP | SP | SP/SqFt | SP/LP | DIM | Score |
|---|---|---|---|---|---|---|---|---|---|---|---|---|---|
| 4833 Date Street | San Diego | 1951 | 10/19/2026 | 2 | 1 | 840 | 5,100 | $689,000 | $675,000 | $804 | 0.98 | 60 | 84 |
| 1034 47Th Street | San Diego | 1952 | 12/04/2025 | 2 | 1 | 812 | 4,937 | $649,999 | $655,000 | $807 | 1.01 | 41 | 81 |
| 891 Morrison | San Diego | 1949 | 12/18/2025 | 2 | 1 | 902 | 5,900 | $599,000 | $620,000 | $687 | 1.03 | 41 | 80 |
| 3820 Hilltop Drive | San Diego | 1955 | 04/16/2026 | 3 | 2 | 1,280 | 5,911 | $800,000 | $750,000 | $586 | 0.94 | 163 | 72 |
| 514 42nd Street | San Diego | 1926 | 01/14/2026 | 2 | 1 | 602 | 5,830 | $599,000 | $599,000 | $995 | 1.00 | 171 | 69 |
| Total: 5 · Average | 2.2 | 1.2 | 887.2 | 5,535.6 | $659,800 | $659,800 | $775.8 | — | 95.2 | ||||
| Median | 840 | $655,000 | $655,000 | ||||||||||
Market Analysis
List vs Sale $/SqFt
Sale Price Trend
Days on Market
Sale vs List Price
This analysis was generated automatically from MLS data. For an in-depth, human-reviewed valuation, contact Joseph Sardella at josephsardella@gmail.com.