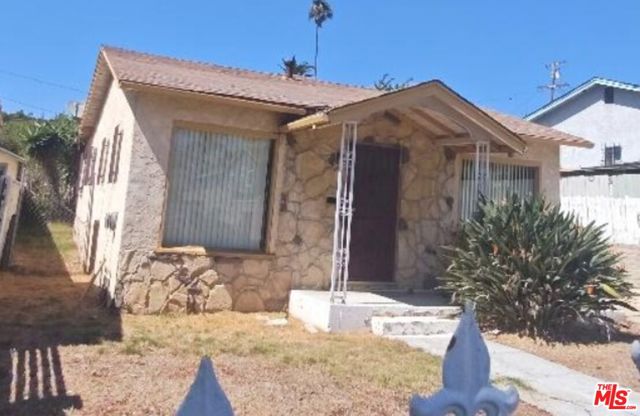
909 East Brett Street, Inglewood, CA 90302
909 East Brett Street, Inglewood, CA 90302
Property Description
Investors Delight! Outstanding investment opportunity in the rapidly evolving City of Inglewood. This 1923 detached home needs work, but its location on a deep R2 lot delivers major upside potential, just moments from SoFi Stadium, Intuit Dome, YouTube Theater, and the entire world class sports and entertainment redevelopment area. The property includes a one car garage with an attached bonus room (unpermitted) and a classic early century footprint ready for renovation. Perfect for investors seeking a project in a city experiencing explosive growth and long term demand. This property offers excellent potential for restoration or redevelopment. Sold "As Is".
Features & Amenities
Property Details
Mortgage Calculator
Current Rates
Comparative Market Analysis
Affordable Tier · 5 active · 5 closed
Inglewood · Single Family Residence
Listed 8.0% above the median closed sale of $610,000. Price per sqft ($763) is a 34% premium to closed comps ($571). Closed comps sold at 90% of list — buyers have negotiating leverage.
Price Position
Positioned above the market — commands a premium.
Active Properties (5)
Active Comparables
| Address | City | Year | BD | BTH | SqFt | LotSz | LP/SqFt | LP | DIM | Score |
|---|---|---|---|---|---|---|---|---|---|---|
| 4316 59th Street | Los Angeles | 1948 | 2 | 1 | 840 | 5,429 | $774 | $650,000 | 38 | 83 |
| 1315 Field Avenue | Inglewood | 1947 | 2 | 2 | 984 | 2,553 | $700 | $689,000 | 2 | 78 |
| 1315 Field Avenue | Inglewood | 1947 | 2 | 2 | 984 | 2,553 | $737 | $725,000 | 94 | 77 |
| 3623 59TH Street | Los Angeles | 1934 | 2 | 1 | 1,184 | 0 | $612 | $725,000 | 158 | 75 |
| 3123 Hyde Park Boulevard | Los Angeles | 1922 | 3 | 2 | 1,147 | 3,895 | $584 | $670,000 | 213 | 69 |
| Total: 5 · Average | 2.2 | 1.6 | 1,027.8 | 3,607.5 | $681.4 | $691,800 | 101 | |||
| Median | 984 | $689,000 | ||||||||
Closed Properties (5)
Closed Comparables
| Address | City | Year | Date | BD | BTH | SqFt | LotSz | LP | SP | SP/SqFt | SP/LP | DIM | Score |
|---|---|---|---|---|---|---|---|---|---|---|---|---|---|
| 900 65th Street | Inglewood | 1923 | 08/21/2026 | 2 | 1 | 1,085 | 5,266 | $800,000 | $590,000 | $544 | 0.74 | 112 | 89 |
| 6330 Harcourt Avenue | Los Angeles | 1923 | 11/26/2025 | 2 | 1 | 892 | 5,440 | $650,000 | $595,000 | $667 | 0.92 | 87 | 89 |
| 1045 Hyde Park Blvd | Inglewood | 1938 | 01/27/2026 | 2 | 1 | 995 | 5,287 | $665,000 | $610,000 | $613 | 0.92 | 139 | 80 |
| 6030 Alviso Avenue | Los Angeles | 1926 | 04/28/2026 | 3 | 1 | 1,297 | 4,828 | $735,000 | $740,000 | $571 | 1.01 | 70 | 77 |
| 6307 Harcourt Avenue | Los Angeles | 1923 | 10/19/2026 | 3 | 2 | 1,339 | 5,440 | $669,950 | $615,000 | $459 | 0.92 | 66 | 74 |
| Total: 5 · Average | 2.4 | 1.2 | 1,121.6 | 5,252.2 | $630,000 | $630,000 | $570.8 | — | 94.8 | ||||
| Median | 1,085 | $610,000 | $610,000 | ||||||||||
Market Analysis
List vs Sale $/SqFt
Sale Price Trend
Days on Market
Sale vs List Price
This analysis was generated automatically from MLS data. For an in-depth, human-reviewed valuation, contact Joseph Sardella at josephsardella@gmail.com.