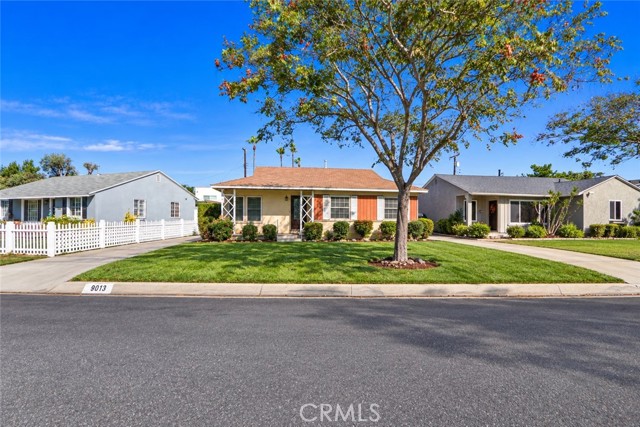
9013 Borson, Downey, CA 90242
9013 Borson, Downey, CA 90242
Property Description
Prime Downey Location Endless Possibilities! Welcome to this charming 3-bedroom, 1-bath home nestled in a highly desirable area of Downey, Southern California! This home features updated recessed lighting, a newer kitchen, and newer central heating and air conditioning for year-round comfort. Step outside to an expansive backyard offering endless possibilities! Whether you envision adding an ADU, building your dream pool, creating the ultimate outdoor entertainment space, or exploring potential RV parking, the opportunities are endless! Conveniently located near shopping, dining, schools, and major freeways, this property offers the perfect combination of location, comfort, and potential. Bring your imagination and make this home your own the sky's the limit!
Features & Amenities
Property Details
Mortgage Calculator
Current Rates
Comparative Market Analysis
Affordable Tier · 5 active · 5 closed
Downey · Single Family Residence
Listed 3.7% above the median closed sale of $800,000. Price per sqft ($844) is a 33% premium to closed comps ($635).
Price Position
Aligned with the market — fair pricing for the comps.
Active Properties (5)
Active Comparables
| Address | City | Year | BD | BTH | SqFt | LotSz | LP/SqFt | LP | DIM | Score |
|---|---|---|---|---|---|---|---|---|---|---|
| 13677 Carfax Avenue | Bellflower | 1952 | 3 | 1 | 986 | 5,575 | $786 | $775,000 | 43 | 85 |
| 13041 Corrigan Avenue | Downey | 1954 | 3 | 2 | 1,210 | 5,609 | $743 | $899,000 | 3 | 83 |
| 8237 Arnett | Downey | 1946 | 3 | 1 | 1,005 | 5,966 | $850 | $854,000 | 101 | 83 |
| 14523 Coke Avenue | Paramount | 1956 | 3 | 2 | 1,240 | 4,945 | $641 | $795,000 | 4 | 80 |
| 9442 Van Ruiten Street | Bellflower | 1948 | 4 | 2 | 1,100 | 5,920 | $727 | $800,000 | 30 | 79 |
| Total: 5 · Average | 3.2 | 1.6 | 1,108.2 | 5,603 | $749.4 | $824,600 | 36.2 | |||
| Median | 1,100 | $800,000 | ||||||||
Closed Properties (5)
Closed Comparables
| Address | City | Year | Date | BD | BTH | SqFt | LotSz | LP | SP | SP/SqFt | SP/LP | DIM | Score |
|---|---|---|---|---|---|---|---|---|---|---|---|---|---|
| 9220 Birdvale | Downey | 1950 | 05/22/2026 | 3 | 1 | 1,031 | 5,363 | $799,000 | $800,000 | $776 | 1.00 | 118 | 91 |
| 12752 Cowley | Downey | 1953 | 05/19/2026 | 3 | 2 | 1,276 | 5,002 | $795,000 | $810,000 | $635 | 1.02 | 39 | 84 |
| 9226 Foster | Bellflower | 1950 | 04/30/2026 | 3 | 1 | 1,296 | 5,555 | $789,900 | $780,000 | $602 | 0.99 | 21 | 84 |
| 12817 Blodgett Avenue | Downey | 1950 | 08/11/2026 | 3 | 2 | 1,278 | 5,010 | $798,000 | $800,000 | $626 | 1.00 | 20 | 82 |
| 8516 Lyndora | Downey | 1949 | 06/25/2026 | 3 | 2 | 1,441 | 5,188 | $789,900 | $770,000 | $534 | 0.97 | 162 | 78 |
| Total: 5 · Average | 3.0 | 1.6 | 1,264.4 | 5,223.6 | $792,000 | $792,000 | $634.6 | — | 72 | ||||
| Median | 1,278 | $800,000 | $800,000 | ||||||||||
Market Analysis
List vs Sale $/SqFt
Sale Price Trend
Days on Market
Sale vs List Price
This analysis was generated automatically from MLS data. For an in-depth, human-reviewed valuation, contact Joseph Sardella at josephsardella@gmail.com.