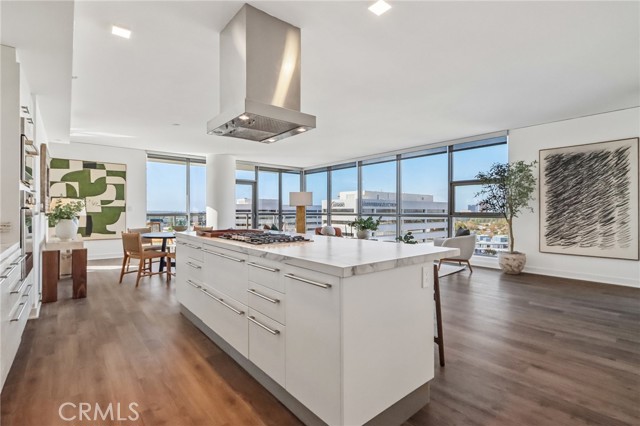
9 MacArthur Place, 1507, Santa Ana, CA 92707
9 MacArthur Place, 1507, Santa Ana, CA 92707
Property Description
Welcome to Skyline OC — the tallest residential building in Orange County and South Coast's boldest condo transformation, where timeless design meets coastal energy. Ideally located in the heart of Orange County, Skyline OC offers the perfect balance of urban convenience and resort-style tranquility. Just moments from South Coast Plaza, world-class dining, performing arts, and major business hubs, this exceptional address puts everything within easy reach—while still feeling like a private retreat. Residence N1507 offers an open split floor plan with bedrooms on opposite sides and expansive living areas framed by floor-to-ceiling windows. This corner home enjoys west-facing views of palm trees and city lights, with a private patio overlooking the amenity level and pool deck—an ideal spot for sunset relaxation. The chef-inspired kitchen features a generous island and premium Viking appliances, while the primary suite includes dual vanities, a soaking tub, and a separate glass shower. Wood flooring and abundant natural light complete this elevated home at Skyline OC
Features & Amenities
Property Details
Mortgage Calculator
Current Rates
Comparative Market Analysis
Residential Tier · 5 active · 5 closed
Santa Ana · Condominium
Listed 6.2% below the median closed sale of $1,310,000.
Price Position
Priced below the market — value advantage over the field.
Active Properties (5)
Active Comparables
| Address | City | Year | BD | BTH | SqFt | LotSz | LP/SqFt | LP | DIM | Score |
|---|---|---|---|---|---|---|---|---|---|---|
| 9 MacArthur Place | Santa Ana | 2008 | 2 | 2 | 1,596 | 133,076 | $813 | $1.30M | 31 | 99 |
| 9 Macarthur | Santa Ana | 2008 | 2 | 2 | 1,295 | 126,132 | $926 | $1.20M | 20 | 90 |
| 2218 Synergy | Irvine | 2020 | 4 | 4 | 2,002 | 0 | $549 | $1.10M | 40 | 68 |
| 1210 Rivington | Irvine | 2024 | 2 | 2 | 1,926 | 0 | $724 | $1.40M | 51 | 66 |
| 227 Bowery | Irvine | 2019 | 2 | 3 | 1,766 | 9,278 | $651 | $1.15M | 82 | 65 |
| Total: 5 · Average | 2.4 | 2.6 | 1,717 | 89,495.333 | $732.6 | $1.23M | 44.8 | |||
| Median | 1,766 | $1.20M | ||||||||
Closed Properties (5)
Closed Comparables
| Address | City | Year | Date | BD | BTH | SqFt | LotSz | LP | SP | SP/SqFt | SP/LP | DIM | Score |
|---|---|---|---|---|---|---|---|---|---|---|---|---|---|
| 117 Placemark | Irvine | 2021 | 09/16/2026 | 3 | 4 | 1,990 | 0 | $1.22M | $1.17M | $587 | 0.96 | 89 | 77 |
| 1310 Rivington | Irvine | 2024 | 04/17/2026 | 2 | 2 | 1,794 | 0 | $1.35M | $1.31M | $730 | 0.97 | 115 | 70 |
| 1702 Rivington | Irvine | 2024 | 01/12/2026 | 1 | 2 | 1,540 | 0 | $1.28M | $1.21M | $786 | 0.94 | 60 | 69 |
| 158 Placemark | Irvine | 2021 | 02/18/2026 | 3 | 4 | 2,100 | 142,599 | $1.38M | $1.38M | $657 | 1.00 | 36 | 68 |
| 4600 Rivington | Irvine | 2024 | 09/30/2026 | 2 | 3 | 1,804 | 250,092 | $1.50M | $1.40M | $776 | 0.94 | 68 | 67 |
| Total: 5 · Average | 2.2 | 3.0 | 1,845.6 | 196,345.5 | $1.29M | $1.29M | $707.2 | — | 73.6 | ||||
| Median | 1,804 | $1.31M | $1.31M | ||||||||||
Market Analysis
List vs Sale $/SqFt
Sale Price Trend
Days on Market
Sale vs List Price
This analysis was generated automatically from MLS data. For an in-depth, human-reviewed valuation, contact Joseph Sardella at josephsardella@gmail.com.