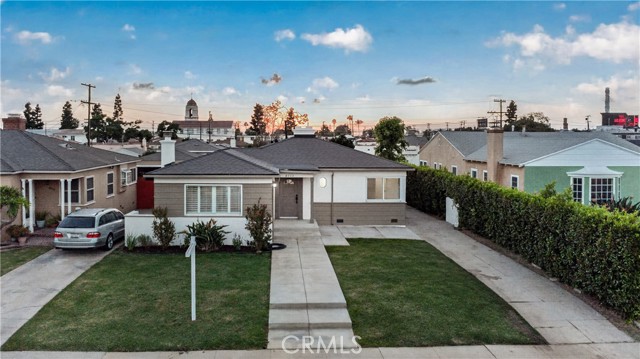
8713 South 7th Avenue, Inglewood, CA 90305
8713 South 7th Avenue, Inglewood, CA 90305
Property Description
Exceptional Opportunity in Inglewood! This beautifully remodeled single-story home, offering a bright and inviting interior with an abundance of natural light throughout. Fresh landscaping enhances the property’s curb appeal and creates a welcoming first impression. The thoughtfully designed floor plan features two bathrooms, including a primary bathroom with a convenient stand-up shower and a secondary bathroom offering both a separate shower and relaxing soaking tub. The home also provides a separate side yard in addition to the backyard, offering flexibility for outdoor enjoyment, entertaining, or additional space. A detached two-car garage is located at the rear of the property and is accessible through convenient drive-through parking. With its remodeled interior, fresh landscaping, bright living spaces, and versatile outdoor areas, this home offers a comfortable and functional setting in a desirable Inglewood location.
Features & Amenities
Property Details
Mortgage Calculator
Current Rates
Comparative Market Analysis
Residential Tier · 5 active · 5 closed
Inglewood · Single Family Residence
Listed in line with the median closed sale of $1,045,000.
Price Position
Aligned with the market — fair pricing for the comps.
Active Properties (5)
Active Comparables
| Address | City | Year | BD | BTH | SqFt | LotSz | LP/SqFt | LP | DIM | Score |
|---|---|---|---|---|---|---|---|---|---|---|
| 2701 84th Street | Inglewood | 1939 | 3 | 2 | 1,663 | 6,844 | $631 | $1.05M | 31 | 89 |
| 2329 78th Place | Inglewood | 1927 | 3 | 3 | 1,858 | 6,706 | $538 | $1.00M | 5 | 88 |
| 8319 Van Ness Avenue | Inglewood | 1936 | 3 | 2 | 1,468 | 5,000 | $612 | $899,000 | 38 | 87 |
| 2416 80th | Inglewood | 1937 | 3 | 2 | 1,322 | 4,726 | $741 | $979,900 | 39 | 86 |
| 2106 94th Pl | Los Angeles | 1944 | 3 | 2 | 1,678 | 5,151 | $625 | $1.05M | 117 | 86 |
| Total: 5 · Average | 3.0 | 2.2 | 1,597.8 | 5,685.4 | $629.4 | $995,380 | 46 | |||
| Median | 1,663 | $1.00M | ||||||||
Closed Properties (5)
Closed Comparables
| Address | City | Year | Date | BD | BTH | SqFt | LotSz | LP | SP | SP/SqFt | SP/LP | DIM | Score |
|---|---|---|---|---|---|---|---|---|---|---|---|---|---|
| 8909 5th Avenue | Inglewood | 1940 | 01/22/2026 | 3 | 2 | 1,860 | 7,059 | $1.04M | $1.04M | $562 | 1.00 | 27 | 91 |
| 8716 10th Avenue | Inglewood | 1937 | 07/15/2026 | 4 | 3 | 1,519 | 6,651 | $1.13M | $1.12M | $737 | 0.99 | 154 | 90 |
| 8620 4th Avenue | Inglewood | 1941 | 12/12/2025 | 4 | 2 | 1,776 | 8,508 | $1.15M | $1.11M | $625 | 0.97 | 132 | 86 |
| 2917 82nd Place | Inglewood | 1938 | 06/26/2026 | 3 | 2 | 1,582 | 6,251 | $895,000 | $904,000 | $571 | 1.01 | 56 | 85 |
| 2905 83rd Street | Inglewood | 1939 | 04/27/2026 | 4 | 3 | 1,984 | 6,780 | $899,000 | $899,000 | $453 | 1.00 | 130 | 80 |
| Total: 5 · Average | 3.6 | 2.4 | 1,744.2 | 7,049.8 | $1.02M | $1.02M | $589.6 | — | 99.8 | ||||
| Median | 1,776 | $1.04M | $1.04M | ||||||||||
Market Analysis
List vs Sale $/SqFt
Sale Price Trend
Days on Market
Sale vs List Price
This analysis was generated automatically from MLS data. For an in-depth, human-reviewed valuation, contact Joseph Sardella at josephsardella@gmail.com.