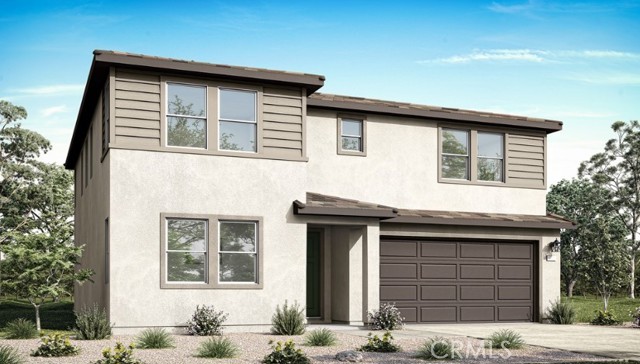
831 Conductor Court, Redlands, CA 92374
831 Conductor Court, Redlands, CA 92374
Property Description
Welcome to Plan 1 at Trolley Heights, a beautifully designed two-story home offering 2,676 sq. ft. of modern living space. This thoughtfully crafted floor plan features 4 bedrooms, 3 bathrooms, a spacious loft, and an open-concept design perfect for both everyday living and entertaining. Enjoy a functional layout with well-positioned bedrooms for added privacy, conveniently located bathrooms, and an upstairs laundry room that adds ease to daily routines. The expansive great room flows seamlessly into the kitchen and dining area, creating an inviting space for gathering with family and friends. This home is under construction and there is still time to customize your cabinets, counter tops, and floors. Estimated completion Jan. 2027
Features & Amenities
Property Details
Mortgage Calculator
Current Rates
Comparative Market Analysis
Residential Tier · 5 active · 5 closed
Redlands · Single Family Residence
Listed in line with the median closed sale of $735,000. Price per sqft ($276) is a 18% discount to closed comps ($335).
Price Position
Aligned with the market — fair pricing for the comps.
Active Properties (5)
Active Comparables
| Address | City | Year | BD | BTH | SqFt | LotSz | LP/SqFt | LP | DIM | Score |
|---|---|---|---|---|---|---|---|---|---|---|
| 826 Conductor Court | Redlands | 2026 | 5 | 3 | 3,037 | 7,200 | $260 | $789,000 | 22 | 94 |
| 783 Railway Lane | Redlands | 2026 | 4 | 3 | 2,676 | 10,755 | $280 | $749,000 | 37 | 94 |
| 811 Conductor Court | Redlands | 2026 | 5 | 3 | 3,455 | 7,200 | $240 | $829,000 | 135 | 90 |
| 2038 Grapefruit Street | Redlands | 2026 | 4 | 3 | 2,168 | 3,500 | $325 | $704,000 | 74 | 88 |
| 2037 Grapefruit Street | Redlands | 2026 | 5 | 3 | 2,418 | 3,500 | $301 | $729,000 | 72 | 88 |
| Total: 5 · Average | 4.6 | 3.0 | 2,750.8 | 6,431 | $281.2 | $760,000 | 68 | |||
| Median | 2,676 | $749,000 | ||||||||
Closed Properties (5)
Closed Comparables
| Address | City | Year | Date | BD | BTH | SqFt | LotSz | LP | SP | SP/SqFt | SP/LP | DIM | Score |
|---|---|---|---|---|---|---|---|---|---|---|---|---|---|
| 934 Fuchsia Circle | Redlands | 2026 | 06/17/2026 | 4 | 3 | 2,168 | 3,500 | $722,700 | $722,700 | $333 | 1.00 | 91 | 87 |
| 2009 Zest Street | Redlands | 2024 | 10/09/2026 | 4 | 3 | 2,168 | 3,500 | $769,000 | $754,500 | $348 | 0.98 | 102 | 87 |
| 2070 Tangelo Lane | Redlands | 2026 | 05/21/2026 | 5 | 3 | 2,418 | 3,500 | $741,900 | $741,900 | $307 | 1.00 | 119 | 86 |
| 2084 Tangelo Lane | Redlands | 2026 | 07/08/2026 | 4 | 3 | 2,020 | 3,500 | $679,000 | $679,000 | $336 | 1.00 | 64 | 86 |
| 1001 Pomelo Ave. | Redlands | 2024 | 03/03/2026 | 4 | 2 | 2,106 | 7,251 | $749,000 | $735,000 | $349 | 0.98 | 55 | 86 |
| Total: 5 · Average | 4.2 | 2.8 | 2,176 | 4,250.2 | $726,620 | $726,620 | $334.6 | — | 86.2 | ||||
| Median | 2,168 | $735,000 | $735,000 | ||||||||||
Market Analysis
List vs Sale $/SqFt
Sale Price Trend
Days on Market
Sale vs List Price
This analysis was generated automatically from MLS data. For an in-depth, human-reviewed valuation, contact Joseph Sardella at josephsardella@gmail.com.