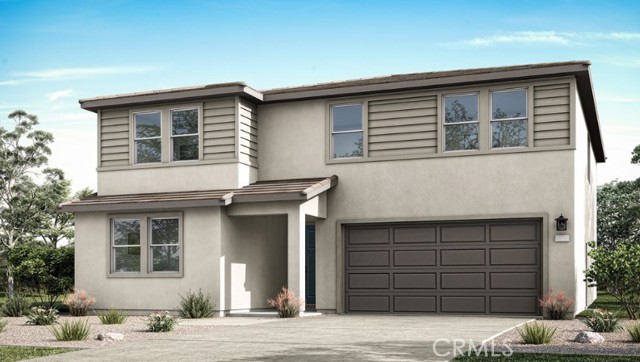
826 Conductor Court, Redlands, CA 92374
826 Conductor Court, Redlands, CA 92374
Property Description
Welcome to Plan 2 at Trolley Heights, a beautifully designed two-story home offering both comfort and style. This spacious floorplan features five bedrooms—including a convenient main-level bedroom—three and a half baths, and a two-bay garage with additional storage space. The home also includes a generous loft, ideal for a media room, office, or flexible living area, along with stylish architectural details throughout that add character and charm. Estimated completion Feb. 2027.
Features & Amenities
Property Details
Mortgage Calculator
Current Rates
Comparative Market Analysis
Luxury Tier · 5 active · 5 closed
Redlands · Single Family Residence
Listed 7.3% above the median closed sale of $735,000. Price per sqft ($260) is a 14% discount to closed comps ($302). Luxury tier — fewer comparable sales widen the confidence range.
Price Position
Positioned above the market — commands a premium.
Active Properties (5)
Active Comparables
| Address | City | Year | BD | BTH | SqFt | LotSz | LP/SqFt | LP | DIM | Score |
|---|---|---|---|---|---|---|---|---|---|---|
| 811 Conductor Court | Redlands | 2026 | 5 | 3 | 3,455 | 7,200 | $240 | $829,000 | 135 | 96 |
| 831 Conductor Court | Redlands | 2026 | 4 | 3 | 2,676 | 7,200 | $276 | $739,000 | 64 | 95 |
| 1048 Lumia Circle | Redlands | 2025 | 5 | 4 | 3,144 | 7,200 | $286 | $899,000 | 9 | 88 |
| 783 Railway Lane | Redlands | 2026 | 4 | 3 | 2,676 | 10,755 | $280 | $749,000 | 37 | 86 |
| 2037 Grapefruit Street | Redlands | 2026 | 5 | 3 | 2,418 | 3,500 | $301 | $729,000 | 72 | 84 |
| Total: 5 · Average | 4.6 | 3.2 | 2,873.8 | 7,171 | $276.6 | $789,000 | 63.4 | |||
| Median | 2,676 | $749,000 | ||||||||
Closed Properties (5)
Closed Comparables
| Address | City | Year | Date | BD | BTH | SqFt | LotSz | LP | SP | SP/SqFt | SP/LP | DIM | Score |
|---|---|---|---|---|---|---|---|---|---|---|---|---|---|
| 1001 Pomelo Ave. | Redlands | 2024 | 03/03/2026 | 4 | 2 | 2,106 | 7,251 | $749,000 | $735,000 | $349 | 0.98 | 55 | 85 |
| 2050 Furlow | Redlands | 2007 | 12/12/2025 | 4 | 3 | 2,696 | 8,668 | $780,000 | $770,000 | $286 | 0.99 | 84 | 84 |
| 2070 Tangelo Lane | Redlands | 2026 | 05/21/2026 | 5 | 3 | 2,418 | 3,500 | $741,900 | $741,900 | $307 | 1.00 | 119 | 83 |
| 1845 Furlow Drive | Redlands | 2006 | 11/19/2025 | 4 | 2 | 2,427 | 7,329 | $680,000 | $680,000 | $280 | 1.00 | 63 | 83 |
| 2046 Meyer Lane | Redlands | 2025 | 11/12/2025 | 5 | 3 | 2,418 | 3,500 | $695,000 | $694,000 | $287 | 1.00 | 71 | 81 |
| Total: 5 · Average | 4.4 | 2.6 | 2,413 | 6,049.6 | $724,180 | $724,180 | $301.8 | — | 78.4 | ||||
| Median | 2,418 | $735,000 | $735,000 | ||||||||||
Market Analysis
List vs Sale $/SqFt
Sale Price Trend
Days on Market
Sale vs List Price
This analysis was generated automatically from MLS data. For an in-depth, human-reviewed valuation, contact Joseph Sardella at josephsardella@gmail.com.