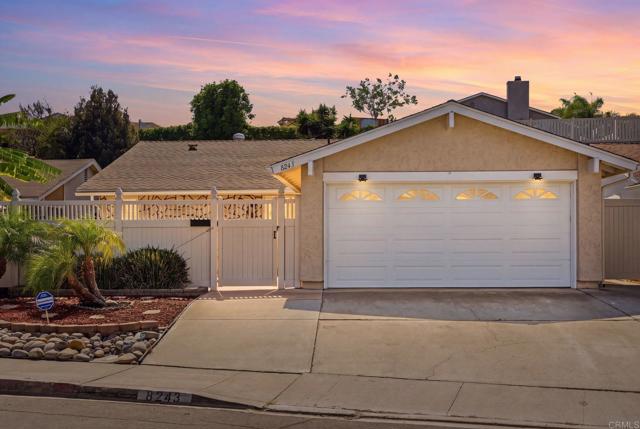
8243 Hydra Lane, San Diego, CA 92126
8243 Hydra Lane, San Diego, CA 92126
Property Description
Space, comfort, and ease come together in this immaculate 5-bedroom, 2.5-bath Mira Mesa home. With no stairs to climb, this true single-level, has no steps up or down. Recently remodeled designer kitchen features quartz counters, stainless steel appliances and shaker hardwood cabinetry with soft close drawers. The kitchen layout is perfect for entertaining with a built-in pantry and large island with seating. The kitchen opens into a fabulous family room with tall exposed wood beam ceilings. With windows on all sides, this sunny entertaining space is the heart of the home. The layout flows naturally from room to room, which makes everyday life simple. Two additional outdoor spaces are perfect for hosting on your covered patio and secure front courtyard. The attached two-car garage provides a convenient doggy bath, 2 car parking and extra room for storage, tools, or recreation gear. Side by side laundry is located in laundry room off garage with extra storage.
Features & Amenities
Property Details
Mortgage Calculator
Current Rates
Comparative Market Analysis
Residential Tier · 5 active · 5 closed
San Diego · Single Family Residence
Listed in line with the median closed sale of $1,151,843. Price per sqft ($645) is a 11% premium to closed comps ($583).
Price Position
Aligned with the market — fair pricing for the comps.
Active Properties (5)
Active Comparables
| Address | City | Year | BD | BTH | SqFt | LotSz | LP/SqFt | LP | DIM | Score |
|---|---|---|---|---|---|---|---|---|---|---|
| 10472 Greenford Drive | San Diego | 1972 | 4 | 2 | 1,637 | 5,000 | $687 | $1.13M | 1 | 82 |
| 11270 Spitfire | San Diego | 1985 | 4 | 3 | 1,822 | 5,044 | $656 | $1.20M | 9 | 79 |
| 8631 Lepus Road | San Diego | 1972 | 3 | 2 | 1,040 | 5,200 | $961 | $999,900 | 32 | 77 |
| 10581 Penridge Street | San Diego | 1990 | 3 | 3 | 1,462 | 5,227 | $787 | $1.15M | 25 | 74 |
| 11843 Westview Parkway | San Diego | 2001 | 4 | 3 | 2,013 | 80,586 | $645 | $1.30M | 39 | 65 |
| Total: 5 · Average | 3.6 | 2.6 | 1,594.8 | 20,211.4 | $747.2 | $1.15M | 21.2 | |||
| Median | 1,637 | $1.15M | ||||||||
Closed Properties (5)
Closed Comparables
| Address | City | Year | Date | BD | BTH | SqFt | LotSz | LP | SP | SP/SqFt | SP/LP | DIM | Score |
|---|---|---|---|---|---|---|---|---|---|---|---|---|---|
| 8324 Calle Calzada | San Diego | 1971 | 02/18/2026 | 4 | 3 | 2,324 | 5,500 | $1.19M | $1.19M | $510 | 1.00 | 34 | 86 |
| 8487 Pallux Way | San Diego | 1971 | 07/07/2026 | 6 | 4 | 2,255 | 5,227 | $1.29M | $1.29M | $572 | 1.00 | 41 | 85 |
| 7851 Parma Lane | San Diego | 1972 | 04/30/2026 | 4 | 2 | 1,894 | 7,405 | $1.09M | $1.07M | $565 | 0.98 | 61 | 84 |
| 10973 Tobago Road | San Diego | 1972 | 06/29/2026 | 4 | 2 | 1,558 | 7,405 | $1.05M | $1.02M | $655 | 0.97 | 97 | 84 |
| 14615 Dunleer Way | San Diego | 2026 | 07/15/2026 | 3 | 3 | 1,875 | 360 | $1.15M | $1.15M | $614 | 1.00 | 78 | 74 |
| Total: 5 · Average | 4.2 | 2.8 | 1,981.2 | 5,179.4 | $1.14M | $1.14M | $583.2 | — | 62.2 | ||||
| Median | 1,894 | $1.15M | $1.15M | ||||||||||
Market Analysis
List vs Sale $/SqFt
Sale Price Trend
Days on Market
Sale vs List Price
This analysis was generated automatically from MLS data. For an in-depth, human-reviewed valuation, contact Joseph Sardella at josephsardella@gmail.com.