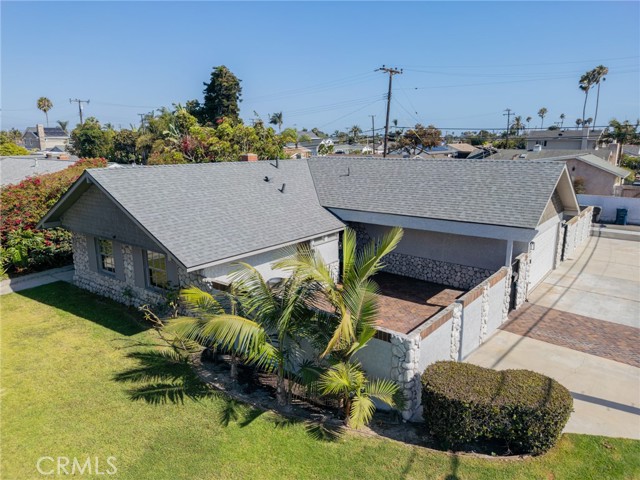
8232 Indianapolis, Huntington Beach, CA 92646
8232 Indianapolis, Huntington Beach, CA 92646
Property Description
Just 1.1 miles from the sand in Surf City USA, this Huntington Beach home offers an incredible opportunity under $1.3 million. Located in an established single-family neighborhood, the property features a two-car garage and generous off-street parking for approximately 8–10 vehicles. Enjoy easy access to downtown Huntington Beach, the pier, boardwalk, restaurants, nightlife, and world-class coastal resorts, while still coming home to a quieter residential setting. Walk or bike to the beach, spend the day by the ocean, and experience the best of the Huntington Beach lifestyle. If you’re ready to live close to the coast with space, parking, and convenience, this is a property you won’t want to miss.
Features & Amenities
Property Details
Mortgage Calculator
Current Rates
Comparative Market Analysis
Affordable Tier · 5 active · 5 closed
Huntington Beach · Single Family Residence
Listed in line with the median closed sale of $1,295,000. Price per sqft ($854) is a 11% discount to closed comps ($959).
Price Position
Aligned with the market — fair pricing for the comps.
Active Properties (5)
Active Comparables
| Address | City | Year | BD | BTH | SqFt | LotSz | LP/SqFt | LP | DIM | Score |
|---|---|---|---|---|---|---|---|---|---|---|
| 1817 Alsuna Lane | Huntington Beach | 1973 | 3 | 2 | 1,349 | 3,660 | $926 | $1.25M | 32 | 86 |
| 8391 Enfield Circle | Huntington Beach | 1961 | 3 | 2 | 1,227 | 5,978 | $1,080 | $1.32M | 16 | 84 |
| 19886 Waterview Lane | Huntington Beach | 1974 | 3 | 2 | 1,440 | 3,468 | $892 | $1.28M | 64 | 82 |
| 8881 Albatross Dr | Huntington Beach | 1963 | 4 | 2 | 1,357 | 6,120 | $951 | $1.29M | 197 | 80 |
| 21241 Lochlea Lane | Huntington Beach | 1969 | 3 | 3 | 1,710 | 6,000 | $847 | $1.45M | 66 | 79 |
| Total: 5 · Average | 3.2 | 2.2 | 1,416.6 | 5,045.2 | $939.2 | $1.32M | 75 | |||
| Median | 1,357 | $1.29M | ||||||||
Closed Properties (5)
Closed Comparables
| Address | City | Year | Date | BD | BTH | SqFt | LotSz | LP | SP | SP/SqFt | SP/LP | DIM | Score |
|---|---|---|---|---|---|---|---|---|---|---|---|---|---|
| 20431 Seven Seas Lane | Huntington Beach | 1963 | 09/30/2026 | 3 | 2 | 1,311 | 6,600 | $1.25M | $1.23M | $938 | 0.98 | 60 | 94 |
| 8401 INDIANAPOLIS | Huntington Beach | 1961 | 08/03/2026 | 3 | 2 | 1,235 | 6,120 | $1.30M | $1.29M | $1,049 | 1.00 | 93 | 92 |
| 8472 Norfolk | Huntington Beach | 1971 | 11/26/2025 | 3 | 2 | 1,691 | 5,580 | $1.50M | $1.47M | $866 | 0.98 | 43 | 85 |
| 8441 Tern Circle | Huntington Beach | 1961 | 11/30/2025 | 3 | 2 | 1,027 | 5,913 | $1.25M | $1.25M | $1,217 | 1.00 | 0 | 84 |
| 8021 Sunset Circle | Huntington Beach | 1963 | 09/21/2026 | 5 | 2 | 2,020 | 6,000 | $1.50M | $1.46M | $723 | 0.97 | 69 | 82 |
| Total: 5 · Average | 3.4 | 2.0 | 1,456.8 | 6,042.6 | $1.34M | $1.34M | $958.6 | — | 53 | ||||
| Median | 1,311 | $1.29M | $1.29M | ||||||||||
Market Analysis
List vs Sale $/SqFt
Sale Price Trend
Days on Market
Sale vs List Price
This analysis was generated automatically from MLS data. For an in-depth, human-reviewed valuation, contact Joseph Sardella at josephsardella@gmail.com.