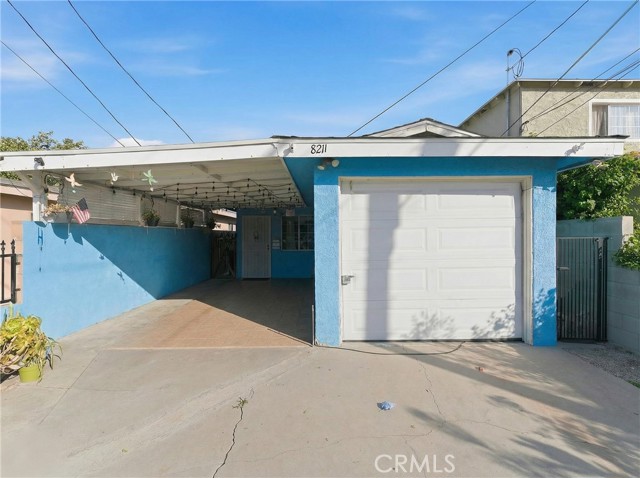
8211 Wilbarn, Paramount, CA 90723
8211 Wilbarn, Paramount, CA 90723
Property Description
Beautifully updated 2-bedroom, 1-bath home with a versatile bonus room perfect as a 3rd bedroom or office. Enjoy a remodeled bathroom, kitchen upgrades, waterproof laminate flooring in bedrooms, tile in living areas, and added natural light from skylight tubes. Home features include a newer roof, new water heater, inside laundry hookups, and a new 6-ft brick wall for added privacy. Move-in ready and conveniently located in the heart of Paramount.
Features & Amenities
Property Details
Mortgage Calculator
Current Rates
Comparative Market Analysis
Affordable Tier · 5 active · 5 closed
Paramount · Single Family Residence
Listed in line with the median closed sale of $600,000. Closed comps sold at 101% of list — strong seller's market.
Price Position
Aligned with the market — fair pricing for the comps.
Active Properties (5)
Active Comparables
| Address | City | Year | BD | BTH | SqFt | LotSz | LP/SqFt | LP | DIM | Score |
|---|---|---|---|---|---|---|---|---|---|---|
| 8206 Olanda | Paramount | 1950 | 2 | 1 | 918 | 4,618 | $653 | $599,900 | 16 | 87 |
| 15120 Bellota Ave | Paramount | 1986 | 2 | 1 | 989 | 3,180 | $657 | $649,900 | 18 | 80 |
| 9153 Rendalia Street | Bellflower | 1951 | 3 | 1 | 1,052 | 6,906 | $523 | $550,000 | 8 | 70 |
| 3023 64th St | Long Beach | 1947 | 2 | 1 | 888 | 4,746 | $664 | $589,999 | 1 | 69 |
| 14517 White | Compton | 1940 | 2 | 1 | 731 | 6,662 | $847 | $619,000 | 4 | 66 |
| Total: 5 · Average | 2.2 | 1.0 | 915.6 | 5,222.4 | $668.8 | $601,759.8 | 9.4 | |||
| Median | 918 | $599,900 | ||||||||
Closed Properties (5)
Closed Comparables
| Address | City | Year | Date | BD | BTH | SqFt | LotSz | LP | SP | SP/SqFt | SP/LP | DIM | Score |
|---|---|---|---|---|---|---|---|---|---|---|---|---|---|
| 8415 Elburg Street | Paramount | 1970 | 12/19/2025 | 2 | 1 | 836 | 2,128 | $550,000 | $540,000 | $646 | 0.98 | 127 | 91 |
| 13942 Anderson | Paramount | 1952 | 07/21/2026 | 3 | 1 | 876 | 3,275 | $680,000 | $615,000 | $702 | 0.90 | 182 | 86 |
| 8237 Rosecrans | Paramount | 1950 | 02/05/2026 | 2 | 1 | 828 | 3,423 | $499,900 | $525,000 | $634 | 1.05 | 86 | 86 |
| 8215 Elburg Street | Paramount | 1955 | 08/06/2026 | 3 | 1 | 1,060 | 2,157 | $610,000 | $618,000 | $583 | 1.01 | 89 | 84 |
| 8340 Quimby | Paramount | 1954 | 05/27/2026 | 2 | 1 | 652 | 3,045 | $550,000 | $600,000 | $920 | 1.09 | 65 | 83 |
| Total: 5 · Average | 2.4 | 1.0 | 850.4 | 2,805.6 | $579,600 | $579,600 | $697 | — | 109.8 | ||||
| Median | 836 | $600,000 | $600,000 | ||||||||||
Market Analysis
List vs Sale $/SqFt
Sale Price Trend
Days on Market
Sale vs List Price
This analysis was generated automatically from MLS data. For an in-depth, human-reviewed valuation, contact Joseph Sardella at josephsardella@gmail.com.