1 / 27
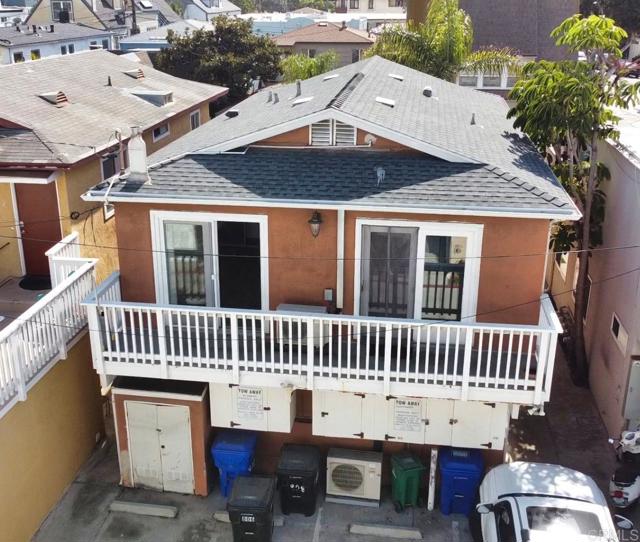
808 jamaica CT, San Diego, CA 92109
$1.2M2bd · 2ba · 978 sqft
HOA $150/mo•Condominium•Active•12d on market•MLS# 8P-2607919
808 jamaica CT, San Diego, CA 92109
MLS# 8P-2607919•Residential•Condominium
Active12 days on market
$1,200,000
2
Beds
2
Baths
978
Sq Ft
$150
HOA/mo
1985
Year Built
Ocean
View
Property Description
Welcome to Mission Beach! Very close to belmont park, shopping, and Dinning. ideal coastal retreat. Located in a 2 unit complex. features central ac & heating,two assign parking spaces, one level on the upper floor. Low HOA, additional storage & washer & dryer hook-ups,
Features & Amenities
FeeBuilt 1985
Property Details
Land Type
Fee
Year Built
1985
Property Type
Residential
Property Subtype
Condominium
Parking Spaces
0
Garage Spaces
0
Cooling
Central Air
View
Ocean
City
San Diego
Zip Code
92109
County
San Diego
Mortgage Calculator
Current Rates
$
$
%
Monthly Payment
$6,067.85
Principal & Interest
Loan Amount
$960,000
Total Interest
$1,224,427
Total Payment Over 30 Years
$2,184,427
This calculator provides estimates only. Actual mortgage payments may include taxes, insurance, HOA fees, and PMI. Contact a lender for accurate quotes.
Comparative Market Analysis
Affordable Tier · 4 active · 4 closed
808 jamaica CT, San Diego, CA 92109
San Diego · Condominium
$1.2M
Affordable TierBeds
2
Baths
2
Sqft
978
Lot
0 sqft
Year
1985
$/Sqft
$1227
Pool: No✓
Spa: No✓
View: Ocean✓
Listed 4.4% above the median closed sale of $1,149,750. Price per sqft ($1,227) is a 51% premium to closed comps ($812).
Price Position
Aligned with the market — fair pricing for the comps.
At market
Subject listed at $1.20M· $1,227/sqft
Total list price
Closed comps
vs closed median $1.16M
+$41K (+3.5%)
Active comps
vs active median $1.10M
+$100K (+9.1%)
Price per sqft
Closed compsinsufficient comp data
Active comps
vs active avg $/sqft $1,209
+$18 (+1.5%)
Active Properties (4)
Active Comparables
| Address | City | Year | BD | BTH | SqFt | LotSz | LP/SqFt | LP | DIM | Score |
|---|---|---|---|---|---|---|---|---|---|---|
| 3250 Strandway | San Diego | 1985 | 2 | 1 | 607 | 0 | $1,977 | $1.20M | 48 | 84 |
| 727 Sapphire Street | San Diego | 1975 | 2 | 2 | 997 | 0 | $1,093 | $1.09M | 56 | 75 |
| 3940 Gresham Street | San Diego | 1974 | 2 | 2 | 1,371 | 87,241 | $765 | $1.05M | 2 | 74 |
| 4944 Cass Street | San Diego | 1973 | 2 | 2 | 1,100 | 0 | $1,000 | $1.10M | 118 | 74 |
| Total: 4 · Average | 2.0 | 1.8 | 1,018.75 | 87,241 | $1,208.75 | $1.11M | 56 | |||
| Median | 1,100 | $1.10M | ||||||||
Closed Properties (4)
Closed Comparables
| Address | City | Year | Date | BD | BTH | SqFt | LotSz | LP | SP | SP/SqFt | SP/LP | DIM | Score |
|---|---|---|---|---|---|---|---|---|---|---|---|---|---|
| 1335 La Palma | San Diego | 1974 | 09/30/2026 | 2 | 2 | 1,271 | 40,049 | $1.13M | $1.13M | $889 | 1.00 | 0 | 75 |
| 1119 Reed Avenue | San Diego | 1985 | 06/30/2026 | 3 | 3 | 1,430 | 6,250 | $1.14M | $1.14M | $797 | 1.00 | 137 | 67 |
| 5027 Santa Monica Avenue | San Diego | 1989 | 04/16/2026 | 3 | 3 | 1,371 | 0 | $1.20M | $1.16M | $846 | 0.97 | 44 | 61 |
| 13459 Savanna | Tustin | 1990 | 08/06/2026 | 3 | 3 | 1,620 | 73,126 | $1.18M | $1.16M | $716 | 0.99 | 36 | 51 |
| Total: 4 · Average | 2.8 | 2.8 | 1,423 | 39,808.333 | $1.15M | $1.15M | $812 | — | 54.25 | ||||
| Median | 1,430 | $1.16M | $1.16M | ||||||||||
Market Analysis
List vs Sale $/SqFt
Sale Price Trend
Days on Market
Sale vs List Price
AI-generated CMA
This analysis was generated automatically from MLS data. For an in-depth, human-reviewed valuation, contact Joseph Sardella at josephsardella@gmail.com.