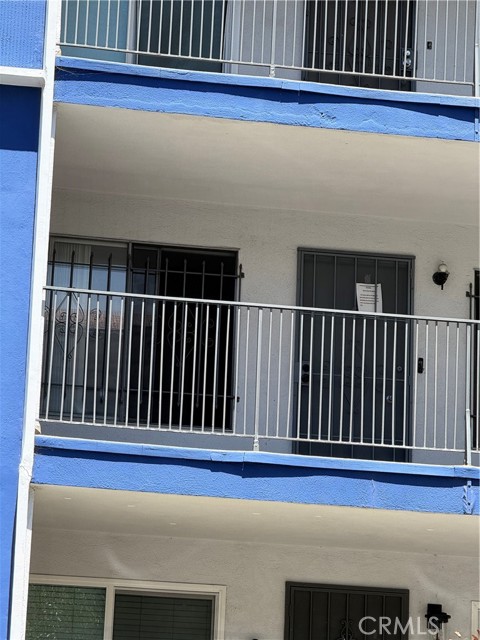
1 / 10
801 East 1st Street, 10, Long Beach, CA 90802
$350K1bd · 1ba · 677 sqft
Lot 7,495 sqft•HOA $193.44/mo•Condominium•Active•73d on market•MLS# SB-26178979
801 East 1st Street, 10, Long Beach, CA 90802
MLS# SB-26178979•Residential•Condominium
Active73 days on market
$350,000
1
Beds
1
Baths
677
Sq Ft
7,495
Lot Sq Ft
$193.44
HOA/mo
1959
Year Built
City Lights
View
Features & Amenities
FeeBuilt 1959
Property Details
Land Type
Fee
Year Built
1959
Property Type
Residential
Property Subtype
Condominium
Parking Spaces
0
Garage Spaces
0
Cooling
None
View
City Lights
City
Long Beach
Zip Code
90802
County
Los Angeles
Mortgage Calculator
Current Rates
$
$
%
Monthly Payment
$1,769.79
Principal & Interest
Loan Amount
$280,000
Total Interest
$357,125
Total Payment Over 30 Years
$637,125
This calculator provides estimates only. Actual mortgage payments may include taxes, insurance, HOA fees, and PMI. Contact a lender for accurate quotes.
Comparative Market Analysis
Affordable Tier · 5 active · 5 closed
801 East 1st Street, 10, Long Beach, CA 90802
Long Beach · Condominium
$350K
Affordable TierBeds
1
Baths
1
Sqft
677
Lot
7,495 sqft
Year
1959
$/Sqft
$517
Pool: No✓
View: city✓
Listed 3.2% above the median closed sale of $339,000.
Price Position
Aligned with the market — fair pricing for the comps.
At market
Subject listed at $350K· $517/sqft
Total list price
Closed comps
vs closed median $339K
+$11K (+3.2%)
Active comps
vs active median $349K
+$1K (+0.3%)
Price per sqft
Closed compsinsufficient comp data
Active comps
vs active avg $/sqft $550
−$33 (−6.0%)
Active Properties (5)
Active Comparables
| Address | City | Year | BD | BTH | SqFt | LotSz | LP/SqFt | LP | DIM | Score |
|---|---|---|---|---|---|---|---|---|---|---|
| 1015 Ocean Boulevard | Long Beach | 1957 | 1 | 1 | 620 | 8,235 | $494 | $306,000 | 115 | 92 |
| 375 Atlantic | Long Beach | 1969 | 1 | 1 | 707 | 11,000 | $495 | $350,000 | 12 | 92 |
| 338 Elm Avenue | Long Beach | 1958 | 1 | 1 | 643 | 7,472 | $466 | $299,900 | 143 | 91 |
| 230 Linden | Long Beach | 1966 | 1 | 1 | 568 | 7,571 | $704 | $399,900 | 91 | 91 |
| 930 1st | Long Beach | 1955 | 1 | 1 | 591 | 11,139 | $591 | $349,000 | 12 | 91 |
| Total: 5 · Average | 1.0 | 1.0 | 625.8 | 9,083.4 | $550 | $340,960 | 74.6 | |||
| Median | 620 | $349,000 | ||||||||
Closed Properties (5)
Closed Comparables
| Address | City | Year | Date | BD | BTH | SqFt | LotSz | LP | SP | SP/SqFt | SP/LP | DIM | Score |
|---|---|---|---|---|---|---|---|---|---|---|---|---|---|
| 100 Cerritos Avenue | Long Beach | 1956 | 10/06/2026 | 1 | 1 | 690 | 7,529 | $339,000 | $339,000 | $491 | 1.00 | 112 | 95 |
| 1227 1st Street | Long Beach | 1961 | 07/17/2026 | 1 | 1 | 668 | 7,501 | $365,000 | $356,000 | $533 | 0.97 | 48 | 93 |
| 102 Lime Avenue | Long Beach | 1949 | 05/28/2026 | 1 | 1 | 684 | 5,520 | $333,000 | $337,000 | $493 | 1.01 | 76 | 91 |
| 250 Linden Avenue | Long Beach | 1964 | 04/15/2026 | 1 | 1 | 597 | 7,512 | $315,000 | $310,000 | $519 | 0.98 | 92 | 90 |
| 615 Broadway | Long Beach | 1972 | 05/19/2026 | 1 | 1 | 644 | 7,571 | $349,900 | $347,000 | $539 | 0.99 | 212 | 89 |
| Total: 5 · Average | 1.0 | 1.0 | 656.6 | 7,126.6 | $337,800 | $337,800 | $515 | — | 108 | ||||
| Median | 668 | $339,000 | $339,000 | ||||||||||
Market Analysis
List vs Sale $/SqFt
Sale Price Trend
Days on Market
Sale vs List Price
AI-generated CMA
This analysis was generated automatically from MLS data. For an in-depth, human-reviewed valuation, contact Joseph Sardella at josephsardella@gmail.com.