1 / 41
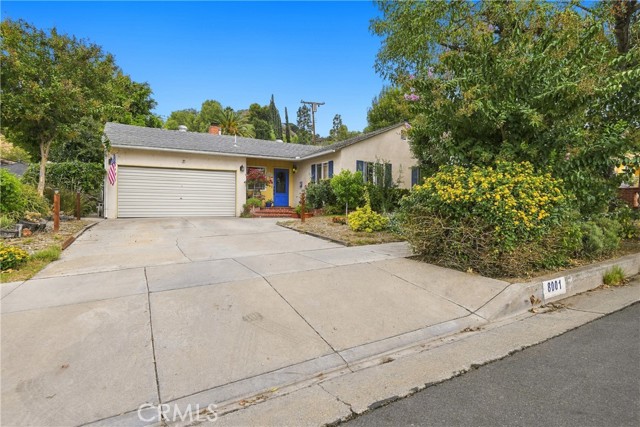
8001 Ellenbogen, Sunland, CA 91040
$925K3bd · 2ba · 1,529 sqft
Lot 6,394 sqft•Single Family Residence•Active•21d on market•MLS# GD-26221340
8001 Ellenbogen, Sunland, CA 91040
MLS# GD-26221340•Residential•Single Family Residence
Active21 days on market
$925,000
3
Beds
2
Baths
1,529
Sq Ft
6,394
Lot Sq Ft
1955
Year Built
None
View
Property Description
This inviting 3-bedroom, 2-bath home located in a quiet and peaceful neighborhood of Sunland. Offering a comfortable living environment with a convenient location, this home is ideal for those seeking both tranquility and accessibility. Nearby shopping, dining, and public transportation, making everyday errands and commuting a breeze. Don’t miss the opportunity to make this wonderful Sunland home your own!
Features & Amenities
FeeBuilt 1955
Property Details
Land Type
Fee
Year Built
1955
Property Type
Residential
Property Subtype
Single Family Residence
Parking Spaces
2
Garage Spaces
2
Heating
Central
Cooling
Central Air
View
None
City
Sunland
Zip Code
91040
County
Los Angeles
Mortgage Calculator
Current Rates
$
$
%
Monthly Payment
$4,677.30
Principal & Interest
Loan Amount
$740,000
Total Interest
$943,829
Total Payment Over 30 Years
$1,683,829
This calculator provides estimates only. Actual mortgage payments may include taxes, insurance, HOA fees, and PMI. Contact a lender for accurate quotes.
Comparative Market Analysis
Residential Tier · 5 active · 5 closed
8001 Ellenbogen, Sunland, CA 91040
Sunland · Single Family Residence
$925K
Residential TierBeds
3
Baths
2
Sqft
1,529
Lot
6,394 sqft
Year
1955
$/Sqft
$605
Pool: No✓
View: None✓
Garage: 2-car✓
Listed 5.1% above the median closed sale of $880,000.
Price Position
Positioned above the market — commands a premium.
Premium
Subject listed at $925K· $605/sqft
Total list price
Closed comps
vs closed median $880K
+$45K (+5.1%)
Active comps
vs active median $895K
+$30K (+3.4%)
Price per sqft
Closed compsinsufficient comp data
Active comps
vs active avg $/sqft $733
−$128 (−17.4%)
Active Properties (5)
Active Comparables
| Address | City | Year | BD | BTH | SqFt | LotSz | LP/SqFt | LP | DIM | Score |
|---|---|---|---|---|---|---|---|---|---|---|
| 7838 Ellenbogen Street | Sunland | 1959 | 3 | 2 | 1,394 | 6,352 | $681 | $949,000 | 83 | 95 |
| 11026 Woodward | Sunland | 1991 | 3 | 2 | 1,208 | 4,256 | $695 | $839,000 | 2 | 86 |
| 8254 Wentworth | Sunland | 1976 | 3 | 2 | 1,455 | 3,565 | $574 | $835,000 | 9 | 80 |
| 7844 Wentworth Street | Sunland | 1940 | 2 | 4 | 1,382 | 4,990 | $687 | $949,000 | 12 | 77 |
| 11064 Plainview | Tujunga | 1923 | 2 | 1 | 872 | 8,648 | $1,026 | $895,000 | 236 | 69 |
| Total: 5 · Average | 2.6 | 2.2 | 1,262.2 | 5,562.2 | $732.6 | $893,400 | 68.4 | |||
| Median | 1,382 | $895,000 | ||||||||
Closed Properties (5)
Closed Comparables
| Address | City | Year | Date | BD | BTH | SqFt | LotSz | LP | SP | SP/SqFt | SP/LP | DIM | Score |
|---|---|---|---|---|---|---|---|---|---|---|---|---|---|
| 8127 Grove Street | Sunland | 1966 | 09/22/2026 | 3 | 2 | 1,512 | 5,988 | $879,000 | $935,000 | $618 | 1.06 | 46 | 95 |
| 11137 Parr Avenue | Sunland | 1959 | 10/07/2026 | 3 | 2 | 1,374 | 6,001 | $874,950 | $880,000 | $640 | 1.01 | 43 | 93 |
| 8048 WENTWORTH Street | Sunland | 1955 | 04/06/2026 | 3 | 2 | 1,154 | 6,252 | $999,000 | $995,000 | $862 | 1.00 | 40 | 89 |
| 7941 Wentworth Street | Sunland | 1960 | 07/27/2026 | 3 | 2 | 1,527 | 5,606 | $875,000 | $812,500 | $532 | 0.93 | 126 | 87 |
| 7853 Jayseel | Sunland | 1957 | 06/19/2026 | 3 | 2 | 1,237 | 4,195 | $889,000 | $850,000 | $687 | 0.96 | 125 | 86 |
| Total: 5 · Average | 3.0 | 2.0 | 1,360.8 | 5,608.4 | $894,500 | $894,500 | $667.8 | — | 76 | ||||
| Median | 1,374 | $880,000 | $880,000 | ||||||||||
Market Analysis
List vs Sale $/SqFt
Sale Price Trend
Days on Market
Sale vs List Price
AI-generated CMA
This analysis was generated automatically from MLS data. For an in-depth, human-reviewed valuation, contact Joseph Sardella at josephsardella@gmail.com.