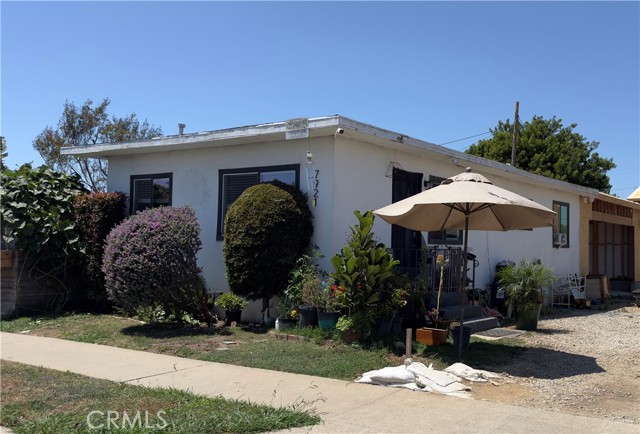
1 / 4
7921 North Ronald Drive, Huntington Beach, CA 92647
$2.58M4bd · 2ba · 1,444 sqft
Lot 9,148 sqft•Single Family Residence•Active•141d on market•MLS# PW-26129874
7921 North Ronald Drive, Huntington Beach, CA 92647
MLS# PW-26129874•Residential•Single Family Residence
Active141 days on market
$2,583,000
4
Beds
2
Baths
1,444
Sq Ft
9,148
Lot Sq Ft
1957
Year Built
None
View
Features & Amenities
FeeBuilt 1957
Property Details
Land Type
Fee
Year Built
1957
Property Type
Residential
Property Subtype
Single Family Residence
Parking Spaces
0
Garage Spaces
0
Heating
Floor Furnace
Cooling
None
View
None
City
Huntington Beach
Zip Code
92647
County
Orange
Mortgage Calculator
Current Rates
$
$
%
Monthly Payment
$13,061.05
Principal & Interest
Loan Amount
$2,066,400
Total Interest
$2,635,579
Total Payment Over 30 Years
$4,701,979
This calculator provides estimates only. Actual mortgage payments may include taxes, insurance, HOA fees, and PMI. Contact a lender for accurate quotes.
Comparative Market Analysis
Luxury Tier · 5 active · 5 closed
7921 North Ronald Drive, Huntington Beach, CA 92647
Huntington Beach · Single Family Residence
$2.58M
Luxury TierBeds
4
Baths
2
Sqft
1,444
Lot
9,148 sqft
Year
1957
$/Sqft
$1789
Pool: No✓
Spa: No✓
View: None✓
Listed 3.7% above the median closed sale of $2,490,000. Price per sqft ($1,789) is a 115% premium to closed comps ($834). Luxury tier — fewer comparable sales widen the confidence range.
Price Position
Aligned with the market — fair pricing for the comps.
At market
Subject listed at $2.58M· $1,789/sqft
Total list price
Closed comps
vs closed median $2.49M
+$93K (+3.7%)
Active comps
vs active median $2.40M
+$184K (+7.7%)
Price per sqft
Closed compsinsufficient comp data
Active comps
vs active avg $/sqft $883
+$906 (+102.6%)
Active Properties (5)
Active Comparables
| Address | City | Year | BD | BTH | SqFt | LotSz | LP/SqFt | LP | DIM | Score |
|---|---|---|---|---|---|---|---|---|---|---|
| 6402 Athena Drive | Huntington Beach | 1965 | 4 | 3 | 3,020 | 10,200 | $960 | $2.90M | 11 | 53 |
| 7381 Siena Drive | Huntington Beach | 2000 | 5 | 4 | 3,047 | 5,095 | $787 | $2.40M | 249 | 51 |
| 8792 Baywood Drive | Huntington Beach | 1976 | 4 | 3 | 2,960 | 6,000 | $760 | $2.25M | 93 | 51 |
| 18362 Oxboro Lane | Huntington Beach | 1980 | 4 | 3 | 2,615 | 6,000 | $956 | $2.50M | 37 | 49 |
| 5911 Woodboro | Huntington Beach | 1975 | 4 | 3 | 2,465 | 6,200 | $953 | $2.35M | 53 | 44 |
| Total: 5 · Average | 4.2 | 3.2 | 2,821.4 | 6,699 | $883.2 | $2.48M | 88.6 | |||
| Median | 2,960 | $2.40M | ||||||||
Closed Properties (5)
Closed Comparables
| Address | City | Year | Date | BD | BTH | SqFt | LotSz | LP | SP | SP/SqFt | SP/LP | DIM | Score |
|---|---|---|---|---|---|---|---|---|---|---|---|---|---|
| 6781 Lawn Haven Drive | Huntington Beach | 1972 | 12/29/2025 | 4 | 3 | 2,193 | 7,500 | $2.50M | $2.49M | $1,135 | 1.00 | 117 | 58 |
| 18692 Calera Drive | Huntington Beach | 1999 | 07/28/2026 | 4 | 3 | 3,104 | 4,845 | $2.60M | $2.58M | $831 | 0.99 | 149 | 56 |
| 19441 Summer Breeze Lane | Huntington Beach | 1969 | 08/10/2026 | 4 | 3 | 2,700 | 7,475 | $2.19M | $2.25M | $835 | 1.03 | 24 | 56 |
| 17777 Joshua Cir | Fountain Valley | 2021 | 09/24/2026 | 5 | 5 | 4,029 | 7,202 | $3.19M | $2.50M | $621 | 0.78 | 131 | 55 |
| 6811 Hitchingpost Circle | Huntington Beach | — | 06/22/2026 | 4 | 3 | 3,297 | 10,306 | $2.10M | $2.46M | $746 | 1.17 | 47 | 54 |
| Total: 5 · Average | 4.2 | 3.4 | 3,064.6 | 7,465.6 | $2.46M | $2.46M | $833.6 | — | 93.6 | ||||
| Median | 3,104 | $2.49M | $2.49M | ||||||||||
Market Analysis
List vs Sale $/SqFt
Sale Price Trend
Days on Market
Sale vs List Price
AI-generated CMA
This analysis was generated automatically from MLS data. For an in-depth, human-reviewed valuation, contact Joseph Sardella at josephsardella@gmail.com.