7848 Di Francesco, Apple Valley, CA 92308
7848 Di Francesco, Apple Valley, CA 92308
Property Description
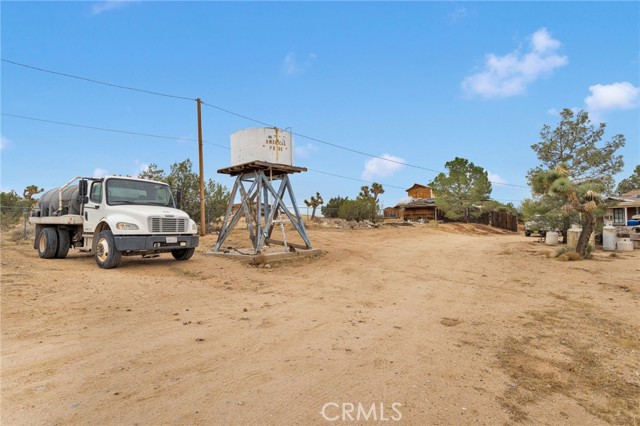
Here is your chance to buy in the desirable “Highlands” area of So. Apple Valley! A mile or so up the dirt road, you will find this quaint 1994 two bed, one bath with plenty of parking sitting on 2.5 acres. As you approach down the driveway you see the 1480 sqft covered porch that wraps around to a Car Port and then around to a cozy front covered patio with its peek-a-boo view of the city lights below. This property features a dog run, chicken coop and a two stall horse shelter with tack room and corrals! There are multiple storages and sheds. There is also a work shop (tools don’t stay) and an underground 256' root-cellar, separate from the house. The home is on a well with 6000 gallons of water storage in 2 tanks. Recent upgrades include a newer 2-3 year old roof and newer 2-3 year old 700’ deep well. This property has a lot to offer!
Features & Amenities
Property Details
Mortgage Calculator
Current Rates
Comparative Market Analysis
Affordable Tier · 2 active · 5 closed
Apple Valley · Single Family Residence
Listed 10.4% below the median closed sale of $355,000. Price per sqft ($431) is a 63% premium to closed comps ($265). Closed comps sold at 103% of list — strong seller's market.
Price Position
Priced below the market — value advantage over the field.
Active Properties (2)
Active Comparables
| Address | City | Year | BD | BTH | SqFt | LotSz | LP/SqFt | LP | DIM | Score |
|---|---|---|---|---|---|---|---|---|---|---|
| 20511 Memory | Apple Valley | 1952 | 3 | 2 | 864 | 173,368 | $417 | $359,999 | 99 | 72 |
| 19765 Rox | Apple Valley | 1988 | 3 | 1 | 2,000 | 207,717 | $170 | $339,900 | 39 | 50 |
| Total: 2 · Average | 3.0 | 1.5 | 1,432 | 190,542.5 | $293.5 | $349,949.5 | 69 | |||
| Median | 2,000 | $359,999 | ||||||||
Closed Properties (5)
Closed Comparables
| Address | City | Year | Date | BD | BTH | SqFt | LotSz | LP | SP | SP/SqFt | SP/LP | DIM | Score |
|---|---|---|---|---|---|---|---|---|---|---|---|---|---|
| 7676 Juniper | Apple Valley | 1949 | 08/19/2026 | 2 | 2 | 1,201 | 87,724 | $365,000 | $355,000 | $296 | 0.97 | 92 | 66 |
| 18548 Main Street | Hesperia | 1979 | 04/27/2026 | 2 | 1 | 930 | 19,798 | $315,000 | $300,000 | $323 | 0.95 | 217 | 55 |
| 9230 Choiceana | Hesperia | 1983 | 06/02/2026 | 3 | 2 | 1,379 | 18,000 | $370,000 | $365,000 | $265 | 0.99 | 76 | 38 |
| 20575 Lupine Street | Apple Valley | 1985 | 03/02/2026 | 3 | 2 | 2,168 | 90,169 | $329,900 | $351,000 | $162 | 1.06 | 68 | 35 |
| 18744 Juniper Street | Hesperia | 1957 | 09/21/2026 | 4 | 2 | 1,295 | 18,000 | $302,000 | $360,111 | $278 | 1.19 | 49 | 34 |
| Total: 5 · Average | 2.8 | 1.8 | 1,394.6 | 46,738.2 | $346,222.2 | $346,222.2 | $264.8 | — | 100.4 | ||||
| Median | 1,295 | $355,000 | $355,000 | ||||||||||
Market Analysis
List vs Sale $/SqFt
Sale Price Trend
Days on Market
Sale vs List Price
This analysis was generated automatically from MLS data. For an in-depth, human-reviewed valuation, contact Joseph Sardella at josephsardella@gmail.com.