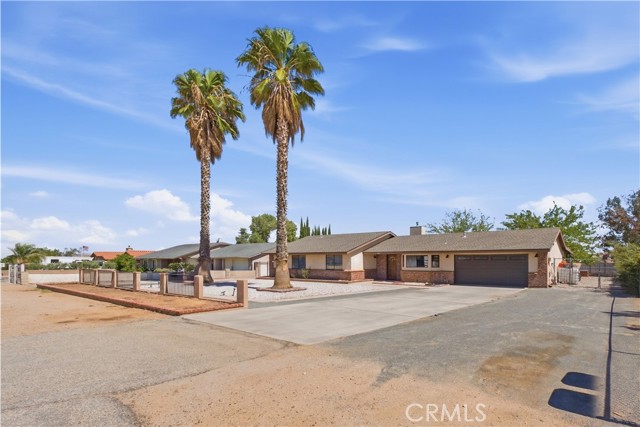
7715 Paisley Ave, Hesperia, CA 92345
7715 Paisley Ave, Hesperia, CA 92345
Property Description
Welcome to 7715 Paisley Ave. Move-in-ready Hesperia home situated on a spacious lot in a quiet residential neighborhood with RV Parking. The renovated kitchen features updated finishes and a functional layout, while the living area showcases a traditional fireplace that adds warmth and character. Comfortable bedrooms provide flexibility for family, guests, or a home office. The expansive backyard creates generous outdoor space for entertaining, gardening, recreation, or relaxing. Conveniently located near shopping, dining, parks, schools, and major transportation routes. A spacious property with a blend of classic character, modern updates, and everyday functionality.
Features & Amenities
Property Details
Mortgage Calculator
Current Rates
Comparative Market Analysis
Affordable Tier · 5 active · 5 closed
Hesperia · Single Family Residence
Listed in line with the median closed sale of $464,000. Closed comps sold at 102% of list — strong seller's market.
Price Position
Aligned with the market — fair pricing for the comps.
Active Properties (5)
Active Comparables
| Address | City | Year | BD | BTH | SqFt | LotSz | LP/SqFt | LP | DIM | Score |
|---|---|---|---|---|---|---|---|---|---|---|
| 17817 Redding | Hesperia | 1984 | 3 | 2 | 1,323 | 19,648 | $302 | $399,000 | 55 | 89 |
| 7889 Gaylop | Hesperia | 1984 | 3 | 2 | 1,697 | 22,800 | $242 | $410,000 | 31 | 89 |
| 17986 Westlawn | Hesperia | 1980 | 3 | 2 | 1,616 | 20,350 | $248 | $399,999 | 219 | 86 |
| 18256 Danbury | Hesperia | 1989 | 3 | 2 | 1,764 | 18,500 | $269 | $475,000 | 47 | 86 |
| 8283 Langdon | Hesperia | 1986 | 3 | 2 | 1,428 | 18,000 | $287 | $410,000 | 61 | 85 |
| Total: 5 · Average | 3.0 | 2.0 | 1,565.6 | 19,859.6 | $269.6 | $418,799.8 | 82.6 | |||
| Median | 1,616 | $410,000 | ||||||||
Closed Properties (5)
Closed Comparables
| Address | City | Year | Date | BD | BTH | SqFt | LotSz | LP | SP | SP/SqFt | SP/LP | DIM | Score |
|---|---|---|---|---|---|---|---|---|---|---|---|---|---|
| 7721 Langdon Avenue | Hesperia | 1989 | 02/27/2026 | 3 | 2 | 1,764 | 18,000 | $455,000 | $475,000 | $269 | 1.04 | 42 | 90 |
| 17930 Seaforth Street | Hesperia | 1986 | 07/23/2026 | 3 | 2 | 1,320 | 20,500 | $434,900 | $445,000 | $337 | 1.02 | 64 | 89 |
| 7861 Madera Avenue | Hesperia | 1986 | 06/16/2026 | 3 | 2 | 1,899 | 18,000 | $450,000 | $457,000 | $241 | 1.02 | 41 | 89 |
| 7697 Windsor Avenue | Hesperia | 1986 | 11/19/2025 | 4 | 2 | 1,502 | 19,000 | $467,500 | $464,000 | $309 | 0.99 | 105 | 84 |
| 7831 Pismo Avenue | Hesperia | 1986 | 09/30/2026 | 5 | 2 | 2,175 | 23,400 | $465,000 | $470,000 | $216 | 1.01 | 37 | 80 |
| Total: 5 · Average | 3.6 | 2.0 | 1,732 | 19,780 | $462,200 | $462,200 | $274.4 | — | 57.8 | ||||
| Median | 1,764 | $464,000 | $464,000 | ||||||||||
Market Analysis
List vs Sale $/SqFt
Sale Price Trend
Days on Market
Sale vs List Price
This analysis was generated automatically from MLS data. For an in-depth, human-reviewed valuation, contact Joseph Sardella at josephsardella@gmail.com.