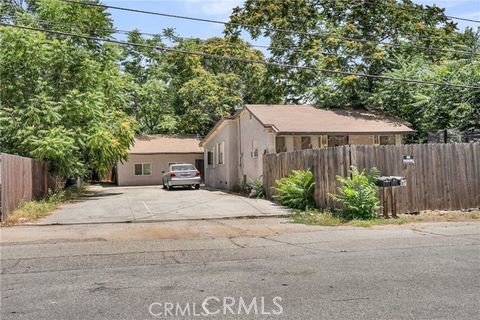
770 Allegheny Avenue, Beaumont, CA 92223
770 Allegheny Avenue, Beaumont, CA 92223
Property Description
THREE UNITS ON 1 LOT!! Charming single-family residence with tenants in place, offering a strong opportunity for an investor or future owner-occupant. Property features 3 units, a 1 bedroom/1 bath (Unit A), an attached studio (Unit B), and a 2 bedroom/1 bath in the rear unit (Unit C). Tenants are currently paying $4,205/month in rent (Unit A - $1,500, Unit B - $1,095), Unit C - $1,610). Utilities are paid for by the tenant based on square footage of unit. Conveniently located nearby several parks and recreation areas to explore such as Sunshine Park, Mountain View Park, Wildflower Park, DeForge Community Park, and Star Carlton Park. Outstandingly close to I-10 for a stress-free and efficient commute. Interior photos of the units are available upon request.
Features & Amenities
Property Details
Mortgage Calculator
Current Rates
Comparative Market Analysis
Residential Tier · 0 active · 4 closed
Beaumont · Single Family Residence
Listed 5.2% below the median closed sale of $580,000. Price per sqft ($326) is a 37% discount to closed comps ($518). Closed comps sold at 81% of list — buyers have negotiating leverage.
Price Position
Priced below the market — value advantage over the field.
Closed Properties (4)
Closed Comparables
| Address | City | Year | Date | BD | BTH | SqFt | LotSz | LP | SP | SP/SqFt | SP/LP | DIM | Score |
|---|---|---|---|---|---|---|---|---|---|---|---|---|---|
| 2108 Artesia Street | Santa Ana | 1963 | 11/24/2025 | 5 | 2 | 1,775 | 6,600 | $925,000 | $600,000 | $338 | 0.65 | 92 | 55 |
| 2220 Halladay St. | Santa Ana | 1949 | 02/06/2025 | 3 | 1 | 1,368 | 5,400 | $650,000 | $615,000 | $450 | 0.95 | 9 | 54 |
| 1533 Greenville | Santa Ana | 1925 | 10/08/2026 | 2 | 1 | 980 | 6,534 | $650,000 | $560,000 | $571 | 0.86 | 79 | 48 |
| 2521 STANFORD Street | Santa Ana | 1952 | 11/06/2025 | 2 | 1 | 748 | 5,220 | $670,000 | $535,000 | $715 | 0.80 | 46 | 42 |
| Total: 4 · Average | 3.0 | 1.3 | 1,217.75 | 5,938.5 | $577,500 | $577,500 | $518.5 | — | 56.5 | ||||
| Median | 1,368 | $600,000 | $600,000 | ||||||||||
Market Analysis
List vs Sale $/SqFt
Sale Price Trend
Days on Market
Sale vs List Price
This analysis was generated automatically from MLS data. For an in-depth, human-reviewed valuation, contact Joseph Sardella at josephsardella@gmail.com.