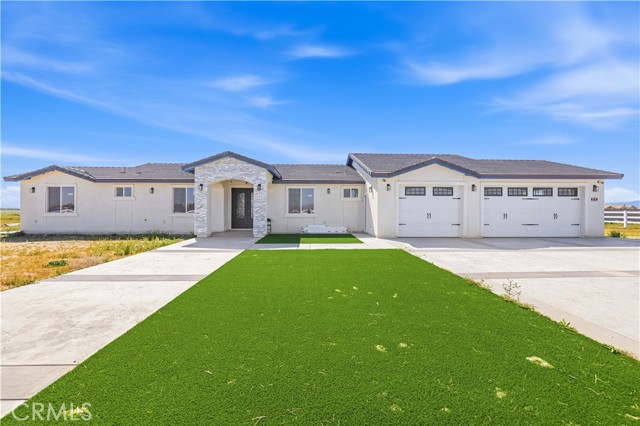
1 / 33
7636 West AVENUE A4, Antelope Acres, CA 93536
$699K4bd · 4ba · 2,200 sqft
Lot 110,132 sqft•Single Family Residence•Active•118d on market•MLS# SR-26148065
7636 West AVENUE A4, Antelope Acres, CA 93536
MLS# SR-26148065•Residential•Single Family Residence
Active118 days on market
$699,000
4
Beds
4
Baths
2,200
Sq Ft
110,132
Lot Sq Ft
2026
Year Built
Property Description
NEW BEUTIFUL RANCH HOME WITH 2.5 ACRES OF LAND IN ANTELOPE ACRES READY FOR YOUR FAMILY
Features & Amenities
FeeBuilt 2026
Property Details
Land Type
Fee
Year Built
2026
Property Type
Residential
Property Subtype
Single Family Residence
Heating
Central, Heat Pump
Cooling
Central Air, Heat Pump, None
City
Antelope Acres
Zip Code
93536
County
Los Angeles
Mortgage Calculator
Current Rates
$
$
%
Monthly Payment
$3,534.52
Principal & Interest
Loan Amount
$559,200
Total Interest
$713,229
Total Payment Over 30 Years
$1,272,429
This calculator provides estimates only. Actual mortgage payments may include taxes, insurance, HOA fees, and PMI. Contact a lender for accurate quotes.
Comparative Market Analysis
Residential Tier · 3 active · 4 closed
7636 West AVENUE A4, Antelope Acres, CA 93536
Antelope Acres · Single Family Residence
$699K
Residential TierBeds
4
Baths
4
Sqft
2,200
Lot
2.53 ac
Year
2026
$/Sqft
$318
Pool: Yes✓
Spa: No✓
Listed 8.2% above the median closed sale of $645,995. Price per sqft ($318) is a 23% premium to closed comps ($258).
Price Position
Aligned with the market — fair pricing for the comps.
At market
Subject listed at $699K· $318/sqft
Total list price
Closed comps
vs closed median $692K
+$7K (+1.0%)
Active comps
vs active median $685K
+$14K (+2.1%)
Price per sqft
Closed compsinsufficient comp data
Active comps
vs active avg $/sqft $251
+$67 (+26.5%)
Active Properties (3)
Active Comparables
| Address | City | Year | BD | BTH | SqFt | LotSz | LP/SqFt | LP | DIM | Score |
|---|---|---|---|---|---|---|---|---|---|---|
| 7740 West Avenue A6 | Lancaster | 2006 | 4 | 3 | 2,496 | 110,468 | $274 | $684,900 | 13 | 84 |
| 7523 Avenue A | Rosamond | 1986 | 5 | 4 | 3,011 | 98,010 | $249 | $749,900 | 46 | 72 |
| 5613 Avenue L1 | Lancaster | 1999 | 5 | 3 | 2,684 | 10,083 | $231 | $619,900 | 17 | 55 |
| Total: 3 · Average | 4.7 | 3.3 | 2,730.333 | 72,853.667 | $251.333 | $684,900 | 25.333333333333332 | |||
| Median | 2,684 | $684,900 | ||||||||
Closed Properties (4)
Closed Comparables
| Address | City | Year | Date | BD | BTH | SqFt | LotSz | LP | SP | SP/SqFt | SP/LP | DIM | Score |
|---|---|---|---|---|---|---|---|---|---|---|---|---|---|
| 7306 Avenue A8 | Lancaster | 2006 | 06/29/2026 | 4 | 4 | 2,375 | 109,553 | $610,000 | $600,000 | $253 | 0.98 | 88 | 89 |
| 7045 A8 | Lancaster | 2025 | 07/21/2025 | 4 | 2 | 2,000 | 108,900 | $599,000 | $599,000 | $300 | 1.00 | 143 | 72 |
| 6842 Birch Avenue | Rosamond | 2008 | 07/24/2026 | 4 | 3 | 3,032 | 108,900 | $799,000 | $792,000 | $261 | 0.99 | 86 | 69 |
| 51140 70th Street | Lancaster | 2009 | 03/21/2025 | 4 | 4 | 3,196 | 95,414 | $699,990 | $691,990 | $217 | 0.99 | 49 | 65 |
| Total: 4 · Average | 4.0 | 3.3 | 2,650.75 | 105,691.75 | $670,747.5 | $670,747.5 | $257.75 | — | 91.5 | ||||
| Median | 3,032 | $691,990 | $691,990 | ||||||||||
Market Analysis
List vs Sale $/SqFt
Sale Price Trend
Days on Market
Sale vs List Price
AI-generated CMA
This analysis was generated automatically from MLS data. For an in-depth, human-reviewed valuation, contact Joseph Sardella at josephsardella@gmail.com.