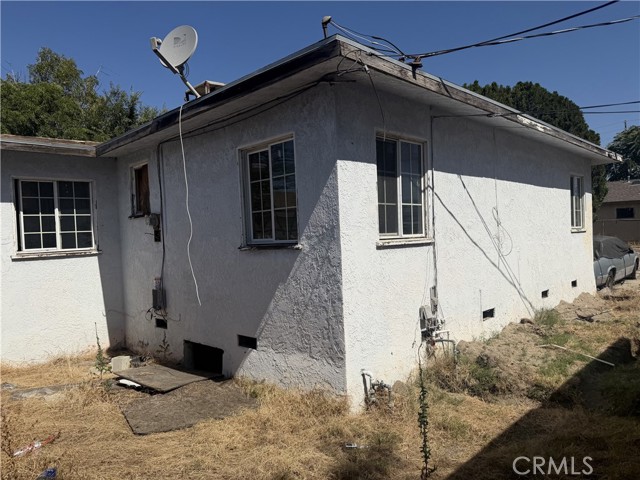
7543 Vineland, Sun Valley, CA 91352
7543 Vineland, Sun Valley, CA 91352
Property Description
Ideal investment property nearly an 1/2 acre was a used car lot. has older home interior was remodeled three years ago. has a two-car detached garage. Home and garage sit on 7550 square foot lot this sale includes lot next to it parcel# 2315013007 which is 11,000 square feet. Seller checked with city and states a 30-unit. complex may be built or seven SFR's. City will give bonuses to buyer if he goes section 8, buyer to verify. Close to Traffic Hub, most freeways including 134, 5, 10, 101 and metro so communing is easy. Property is fenced mixed use property
Features & Amenities
Property Details
Mortgage Calculator
Current Rates
Comparative Market Analysis
Affordable Tier · 5 active · 5 closed
Sun Valley · Single Family Residence
Listed 11.6% above the median closed sale of $1,075,000. Price per sqft ($1,127) is a 87% premium to closed comps ($604).
Price Position
Positioned above the market — commands a premium.
Active Properties (5)
Active Comparables
| Address | City | Year | BD | BTH | SqFt | LotSz | LP/SqFt | LP | DIM | Score |
|---|---|---|---|---|---|---|---|---|---|---|
| 6729 Ensign Avenue | Los Angeles | 1944 | 3 | 2 | 1,370 | 5,720 | $875 | $1.20M | 81 | 73 |
| 2035 Evergreen Street | Burbank | 1944 | 3 | 2 | 1,451 | 6,002 | $827 | $1.20M | 43 | 68 |
| 10254 Roscoe Boulevard | Sun Valley | 1950 | 3 | 3 | 1,494 | 6,015 | $769 | $1.15M | 11 | 65 |
| 7558 Delia | Sun Valley | 1947 | 4 | 3 | 1,605 | 5,672 | $685 | $1.10M | 2 | 63 |
| 2232 Valley Street | Burbank | 1944 | 4 | 2 | 1,770 | 6,002 | $649 | $1.15M | 16 | 62 |
| Total: 5 · Average | 3.4 | 2.4 | 1,538 | 5,882.2 | $761 | $1.16M | 30.6 | |||
| Median | 1,494 | $1.15M | ||||||||
Closed Properties (5)
Closed Comparables
| Address | City | Year | Date | BD | BTH | SqFt | LotSz | LP | SP | SP/SqFt | SP/LP | DIM | Score |
|---|---|---|---|---|---|---|---|---|---|---|---|---|---|
| 11229 Saticoy Street | Sun Valley | 1937 | 08/17/2026 | 2 | 1 | 1,104 | 16,592 | $1.21M | $1.15M | $1,042 | 0.95 | 119 | 86 |
| 7426 Lemp Avenue | North Hollywood | 1956 | 08/25/2026 | 4 | 3 | 1,856 | 6,645 | $999,000 | $1.03M | $553 | 1.03 | 50 | 57 |
| 7641 Beck Avenue | North Hollywood | 1947 | 06/18/2026 | 5 | 3 | 1,849 | 6,491 | $1.10M | $1.09M | $590 | 0.99 | 91 | 56 |
| 7943 Ledge Avenue | Sun Valley | 1938 | 07/17/2026 | 3 | 3 | 2,122 | 10,195 | $1.10M | $1.05M | $495 | 0.95 | 107 | 54 |
| 10741 Stagg Street | Sun Valley | 1953 | 07/24/2026 | 5 | 3 | 3,160 | 14,252 | $1.18M | $1.07M | $340 | 0.92 | 71 | 52 |
| Total: 5 · Average | 3.8 | 2.6 | 2,018.2 | 10,835 | $1.08M | $1.08M | $604 | — | 87.6 | ||||
| Median | 1,856 | $1.07M | $1.07M | ||||||||||
Market Analysis
List vs Sale $/SqFt
Sale Price Trend
Days on Market
Sale vs List Price
This analysis was generated automatically from MLS data. For an in-depth, human-reviewed valuation, contact Joseph Sardella at josephsardella@gmail.com.