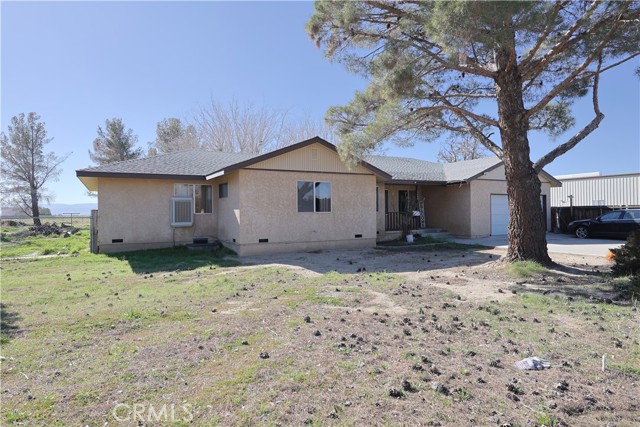
7540 West Avenue A, Lancaster, CA 93536
7540 West Avenue A, Lancaster, CA 93536
Property Description
Assume the loan at 4.5%!!!!! Welcome to wide-open space and endless possibilities in Antelope Acres. This 2.13 acre fully fenced property offers the ideal setup for those seeking room to grow, build, and enjoy a rural lifestyle. The land is thoughtfully laid out with dedicated space for livestock, including areas suitable for horses, chickens, or other animals, plus a permitted workshop and three car garage...perfect for projects, storage, or hobbies. Bring all your toys, trailers, and equipment—there’s plenty of room to spread out while still enjoying privacy and open desert views. Whether you’re looking to build, expand, or create your own ranch-style retreat, this property is **ready for its next owner. A rare opportunity to own usable acreage with improvements already in place in a desirable Antelope Acres location. Call me for your private showing!
Features & Amenities
Property Details
Mortgage Calculator
Current Rates
Comparative Market Analysis
Affordable Tier · 2 active · 5 closed
Lancaster · Single Family Residence
Listed 7.0% above the median closed sale of $467,500. Price per sqft ($314) is a 32% premium to closed comps ($238).
Price Position
Positioned above the market — commands a premium.
Active Properties (2)
Active Comparables
| Address | City | Year | BD | BTH | SqFt | LotSz | LP/SqFt | LP | DIM | Score |
|---|---|---|---|---|---|---|---|---|---|---|
| 7523 Cypress Avenue | Rosamond | 1988 | 3 | 3 | 2,721 | 108,464 | $191 | $519,900 | 34 | 74 |
| 9890 Sue Ave | Rosamond | 2005 | 4 | 2 | 2,574 | 116,741 | $214 | $549,870 | 227 | 44 |
| Total: 2 · Average | 3.5 | 2.5 | 2,647.5 | 112,602.5 | $202.5 | $534,885 | 130.5 | |||
| Median | 2,721 | $549,870 | ||||||||
Closed Properties (5)
Closed Comparables
| Address | City | Year | Date | BD | BTH | SqFt | LotSz | LP | SP | SP/SqFt | SP/LP | DIM | Score |
|---|---|---|---|---|---|---|---|---|---|---|---|---|---|
| 6789 Avenue A | Rosamond | 1987 | 09/29/2026 | 3 | 2 | 2,047 | 98,010 | $499,900 | $467,500 | $228 | 0.94 | 70 | 80 |
| 50950 70th Street West | Lancaster | 1987 | 11/24/2025 | 4 | 2 | 1,759 | 94,961 | $455,639 | $455,639 | $259 | 1.00 | 52 | 79 |
| 7321 Birch Avenue | Rosamond | 1989 | 09/25/2026 | 3 | 2 | 2,496 | 108,464 | $549,000 | $545,000 | $218 | 0.99 | 154 | 77 |
| 6532 Birch Avenue | Rosamond | 1987 | 10/13/2026 | 3 | 2 | 2,360 | 109,038 | $575,000 | $552,500 | $234 | 0.96 | 118 | 74 |
| 2117 Avenue K15 | Lancaster | 1985 | 08/14/2026 | 3 | 3 | 1,838 | 7,309 | $469,900 | $465,000 | $253 | 0.99 | 50 | 73 |
| Total: 5 · Average | 3.2 | 2.2 | 2,100 | 83,556.4 | $497,127.8 | $497,127.8 | $238.4 | — | 88.8 | ||||
| Median | 2,047 | $467,500 | $467,500 | ||||||||||
Market Analysis
List vs Sale $/SqFt
Sale Price Trend
Days on Market
Sale vs List Price
This analysis was generated automatically from MLS data. For an in-depth, human-reviewed valuation, contact Joseph Sardella at josephsardella@gmail.com.