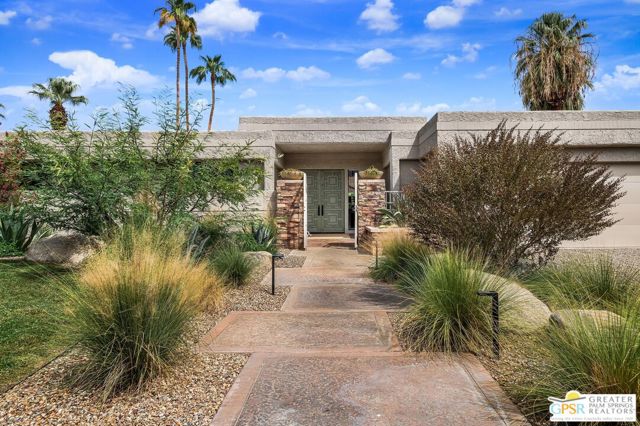
75342 Montecito Drive, Indian Wells, CA 92210
75342 Montecito Drive, Indian Wells, CA 92210
Property Description
Exceptional backyard privacy, open desert skies, and an extensive renovation completed over the past two years distinguish this beautifully reimagined home in Indian Wells' sought-after Rancho Palmeras Estates. With the renovation already complete, you can settle in and enjoy the desert lifestyle from day one. The backyard offers open desert skies uninterrupted by neighboring walls, rooflines, or solar panels. A newly resurfaced pool, converted to saltwater, anchors an inviting outdoor setting for relaxing and entertaining, with Mt. San Jacinto adding to the backdrop. Inside, the expansive great room features a 13-foot ceiling, gas fireplace, wet bar, and walls of glass connecting the interior to the backyard. The fully redesigned kitchen flows seamlessly into the dining room, making entertaining a breeze. Two of the three bedrooms are en suite, while the third is currently enjoyed as a den. All three bathrooms have been completely renovated, and new flooring throughout the home brings a cohesive, refreshed feel to the interior. The thoughtful improvements extend beyond the interior finishes to substantial updates to the home's systems, landscaping, and outdoor spaces. Dual-zone HVAC, owned solar, and a dedicated garage mini-split enhance comfort and efficiency, while the oversized two-car garage provides ample storage and workspace. Indian Wells residents enjoy the advantages of one of the Coachella Valley's most prestigious communities, including exclusive Residential Benefit Program privileges at the Indian Wells Golf Resort, BNP Paribas Open, and other Indian Wells resort properties. Extensively renovated, exceptionally private, and open to the desert sky, this home offers a compelling opportunity to enjoy Indian Wells without taking on a major renovation.
Features & Amenities
Property Details
Mortgage Calculator
Current Rates
About Not in a Development
This property is located in Not in a Development, a community in Indian Wells. Explore more listings in this neighborhood to compare options and pricing.
View Not in a Development ListingsComparative Market Analysis
Luxury Tier · 5 active · 5 closed
Not in a Development · Indian Wells · Single Family Residence
Listed 4.8% above the median closed sale of $1,765,000. Price per sqft ($727) is a 16% premium to closed comps ($627). Luxury tier — fewer comparable sales widen the confidence range.
Price Position
Aligned with the market — fair pricing for the comps.
Active Properties (5)
Active Comparables
| Address | City | Year | BD | BTH | SqFt | LotSz | LP/SqFt | LP | DIM | Score |
|---|---|---|---|---|---|---|---|---|---|---|
| 75371 Mansfield Drive | Indian Wells | 2023 | 3 | 5 | 2,424 | 9,583 | $693 | $1.68M | 16 | 87 |
| 75325 Purple Hills Road | Indian Wells | 1973 | 3 | 3 | 3,158 | 12,197 | $586 | $1.85M | 41 | 86 |
| 75437 Desert Park Drive | Indian Wells | 1985 | 4 | 4 | 3,216 | 8,712 | $515 | $1.66M | 11 | 81 |
| 75065 Promontory Place | Indian Wells | 2006 | 3 | 4 | 3,657 | 10,019 | $574 | $2.10M | 31 | 67 |
| 75073 Spyglass Drive | Indian Wells | 1991 | 4 | 5 | 3,471 | 13,184 | $504 | $1.75M | 14 | 58 |
| Total: 5 · Average | 3.4 | 4.2 | 3,185.2 | 10,739 | $574.4 | $1.81M | 22.6 | |||
| Median | 3,216 | $1.75M | ||||||||
Closed Properties (5)
Closed Comparables
| Address | City | Year | Date | BD | BTH | SqFt | LotSz | LP | SP | SP/SqFt | SP/LP | DIM | Score |
|---|---|---|---|---|---|---|---|---|---|---|---|---|---|
| 75355 Mansfield Drive | Indian Wells | 2023 | 10/19/2026 | 3 | 4 | 2,697 | 9,583 | $1.76M | $1.76M | $654 | 1.00 | 0 | 88 |
| 75224 Citadel Place | Indian Wells | 2022 | 02/26/2026 | 3 | 4 | 3,159 | 10,890 | $2.05M | $2.04M | $646 | 0.99 | 42 | 79 |
| 75307 Mansfield Drive | Indian Wells | 2023 | 06/29/2026 | 3 | 5 | 2,424 | 9,583 | $1.60M | $1.57M | $650 | 0.98 | 14 | 74 |
| 75144 Citadel Place | Indian Wells | 2023 | 04/23/2026 | 3 | 5 | 3,250 | 10,018 | $2.35M | $2.02M | $623 | 0.86 | 125 | 72 |
| 75315 Montecito Drive | Indian Wells | 1979 | 11/21/2025 | 3 | 4 | 3,044 | 10,019 | $1.79M | $1.72M | $564 | 0.96 | 54 | 71 |
| Total: 5 · Average | 3.0 | 4.4 | 2,914.8 | 10,018.6 | $1.82M | $1.82M | $627.4 | — | 47 | ||||
| Median | 3,044 | $1.76M | $1.76M | ||||||||||
Market Analysis
List vs Sale $/SqFt
Sale Price Trend
Days on Market
Sale vs List Price
This analysis was generated automatically from MLS data. For an in-depth, human-reviewed valuation, contact Joseph Sardella at josephsardella@gmail.com.