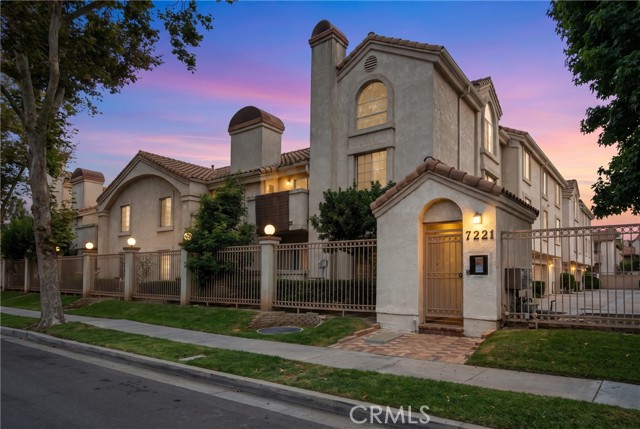
7221 Petrol Street, 22, Paramount, CA 90723
7221 Petrol Street, 22, Paramount, CA 90723
Property Description
Welcome to this charming 2-bedroom, 2-bathroom condominium located in a gated community in Paramount. This is an upper level single story well-maintained approximately 829 square feet of comfortable living space with a functional floor plan with vaulted ceiling in living room and bedrooms, 2 balconies. The property includes two assigned carport parking spaces in front of the unit, providing, Enjoy the added privacy and security of a gated community while being conveniently located near shopping, dining, schools, parks, and major transportation routes. Community also offers pool and jacuzzi A great opportunity awaits
Features & Amenities
Property Details
Mortgage Calculator
Current Rates
Comparative Market Analysis
Affordable Tier · 5 active · 5 closed
Paramount · Condominium
Listed in line with the median closed sale of $429,900. Price per sqft ($507) is a 12% premium to closed comps ($452).
Price Position
Aligned with the market — fair pricing for the comps.
Active Properties (5)
Active Comparables
| Address | City | Year | BD | BTH | SqFt | LotSz | LP/SqFt | LP | DIM | Score |
|---|---|---|---|---|---|---|---|---|---|---|
| 14819 Downey Avenue | Paramount | 1988 | 2 | 2 | 968 | 52,184 | $463 | $448,000 | 156 | 79 |
| 15000 Downey Avenue | Paramount | 1991 | 2 | 1 | 858 | 152,547 | $524 | $450,000 | 193 | 79 |
| 15000 Downey Avenue | Paramount | 1991 | 2 | 1 | 858 | 152,602 | $524 | $450,000 | 135 | 76 |
| 16211 Downey | Paramount | 1981 | 1 | 1 | 776 | 329,662 | $554 | $430,000 | 17 | 75 |
| 8634 Park Street | Bellflower | 1981 | 2 | 2 | 826 | 12,004 | $557 | $460,000 | 35 | 73 |
| Total: 5 · Average | 1.8 | 1.4 | 857.2 | 139,799.8 | $524.4 | $447,600 | 107.2 | |||
| Median | 858 | $450,000 | ||||||||
Closed Properties (5)
Closed Comparables
| Address | City | Year | Date | BD | BTH | SqFt | LotSz | LP | SP | SP/SqFt | SP/LP | DIM | Score |
|---|---|---|---|---|---|---|---|---|---|---|---|---|---|
| 15351 Orange Ave | Paramount | 1979 | 10/14/2026 | 2 | 2 | 837 | 63,435 | $394,999 | $405,000 | $484 | 1.02 | 71 | 90 |
| 15351 Orange | Paramount | 1979 | 08/21/2026 | 2 | 2 | 852 | 63,435 | $429,900 | $429,900 | $505 | 1.00 | 74 | 89 |
| 7260 Richfield Street | Paramount | 1979 | 11/24/2025 | 2 | 2 | 925 | 80,303 | $469,000 | $440,000 | $476 | 0.94 | 36 | 83 |
| 15137 Gundry Ave. | Paramount | 1980 | 07/10/2026 | 2 | 2 | 1,081 | 35,103 | $498,000 | $475,000 | $439 | 0.95 | 169 | 80 |
| 7021 Alondra Boulevard | Paramount | 1980 | 09/28/2026 | 2 | 2 | 1,180 | 1,142 | $441,500 | $420,000 | $356 | 0.95 | 96 | 74 |
| Total: 5 · Average | 2.0 | 2.0 | 975 | 48,683.6 | $433,980 | $433,980 | $452 | — | 89.2 | ||||
| Median | 925 | $429,900 | $429,900 | ||||||||||
Market Analysis
List vs Sale $/SqFt
Sale Price Trend
Days on Market
Sale vs List Price
This analysis was generated automatically from MLS data. For an in-depth, human-reviewed valuation, contact Joseph Sardella at josephsardella@gmail.com.