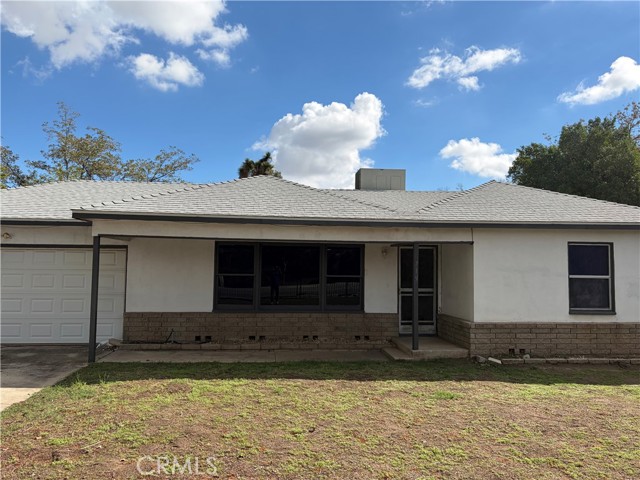
719 South Meridian, San Bernardino, CA 92410
719 South Meridian, San Bernardino, CA 92410
Property Description
GREAT OPPORTUNITY: Single family residence now available in a prime location (near schools, shopping areas & close to a major freeway). This spacious SFR has 3 bedrooms, 1 bathroom, central air/heating, 2 car garage, an extended carport, an electric entrance gate, an in-ground swimming pool and hardwood flooring. This property appears ideal for first time home buyer(s) or for long term investment. Good opportunities don't come around too often, so don't WAIT!
Features & Amenities
Property Details
Mortgage Calculator
Current Rates
Comparative Market Analysis
Affordable Tier · 5 active · 5 closed
San Bernardino · Single Family Residence
Listed 7.6% below the median closed sale of $550,000. Price per sqft ($406) is a 12% premium to closed comps ($361). Closed comps sold at 100% of list — strong seller's market.
Price Position
Priced below the market — value advantage over the field.
Active Properties (5)
Active Comparables
| Address | City | Year | BD | BTH | SqFt | LotSz | LP/SqFt | LP | DIM | Score |
|---|---|---|---|---|---|---|---|---|---|---|
| 1410 Tejon Avenue | Colton | 1955 | 4 | 2 | 1,248 | 7,920 | $369 | $460,000 | 61 | 80 |
| 1420 Rancho Avenue | Colton | 1965 | 4 | 2 | 1,476 | 6,615 | $393 | $580,000 | 66 | 77 |
| 2883 Hollow Glen Circle | Rialto | 1985 | 3 | 3 | 1,335 | 3,484 | $386 | $514,900 | 37 | 74 |
| 379 Randall | Rialto | 1972 | 4 | 2 | 1,536 | 6,600 | $367 | $564,000 | 61 | 73 |
| 832 Rexford | Rialto | 1986 | 3 | 3 | 1,335 | 3,600 | $374 | $499,900 | 69 | 72 |
| Total: 5 · Average | 3.6 | 2.4 | 1,386 | 5,643.8 | $377.8 | $523,760 | 58.8 | |||
| Median | 1,335 | $514,900 | ||||||||
Closed Properties (5)
Closed Comparables
| Address | City | Year | Date | BD | BTH | SqFt | LotSz | LP | SP | SP/SqFt | SP/LP | DIM | Score |
|---|---|---|---|---|---|---|---|---|---|---|---|---|---|
| 640 San Carlo Ave | Colton | 1989 | 11/21/2025 | 3 | 2 | 1,317 | 7,200 | $525,000 | $550,000 | $418 | 1.05 | 67 | 74 |
| 1075 Leslie Court | Colton | 1990 | 02/19/2026 | 3 | 2 | 1,379 | 7,865 | $460,000 | $440,000 | $319 | 0.96 | 17 | 72 |
| 648 SAN CARLO | Colton | 1989 | 07/21/2026 | 3 | 3 | 1,500 | 7,200 | $570,900 | $570,000 | $380 | 1.00 | 131 | 71 |
| 834 Lassen Avenue | San Bernardino | 1989 | 12/17/2025 | 3 | 3 | 1,574 | 7,200 | $569,000 | $569,000 | $361 | 1.00 | 100 | 66 |
| 875 Rexford Street | Rialto | 1986 | 11/07/2025 | 3 | 3 | 1,563 | 3,600 | $508,000 | $515,000 | $329 | 1.01 | 93 | 61 |
| Total: 5 · Average | 3.0 | 2.6 | 1,466.6 | 6,613 | $528,800 | $528,800 | $361.4 | — | 81.6 | ||||
| Median | 1,500 | $550,000 | $550,000 | ||||||||||
Market Analysis
List vs Sale $/SqFt
Sale Price Trend
Days on Market
Sale vs List Price
This analysis was generated automatically from MLS data. For an in-depth, human-reviewed valuation, contact Joseph Sardella at josephsardella@gmail.com.