1 / 1
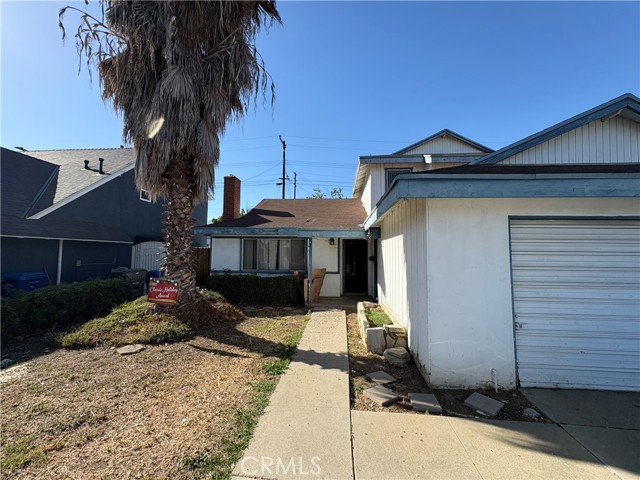
713 Bartolo, Montebello, CA 90640
$699K4bd · 2ba · 1,832 sqft
Lot 4,959 sqft•Single Family Residence•Active•3d on market•MLS# OC-26234245
713 Bartolo, Montebello, CA 90640
MLS# OC-26234245•Residential•Single Family Residence
Active3 days on market
$699,000
4
Beds
2
Baths
1,832
Sq Ft
4,959
Lot Sq Ft
1962
Year Built
None
View
Property Description
Fixer upper in a great neighborhood. This home has a lot of potential. Cul-de-sac. 4 bedroom, 2 full bathrooms with two bedrooms and one full bathroom downstairs and two bedrooms with one full adjoining bathroom upstairs.
Features & Amenities
FeeBuilt 1962
Property Details
Land Type
Fee
Year Built
1962
Property Type
Residential
Property Subtype
Single Family Residence
Parking Spaces
2
Garage Spaces
2
Heating
Central
Cooling
Wall/Window Unit(s)
View
None
City
Montebello
Zip Code
90640
County
Los Angeles
Mortgage Calculator
Current Rates
$
$
%
Monthly Payment
$3,534.52
Principal & Interest
Loan Amount
$559,200
Total Interest
$713,229
Total Payment Over 30 Years
$1,272,429
This calculator provides estimates only. Actual mortgage payments may include taxes, insurance, HOA fees, and PMI. Contact a lender for accurate quotes.
Comparative Market Analysis
Residential Tier · 5 active · 5 closed
713 Bartolo, Montebello, CA 90640
Montebello · Single Family Residence
$699K
Residential TierBeds
4
Baths
2
Sqft
1,832
Lot
4,959 sqft
Year
1962
$/Sqft
$382
Pool: No✓
View: None✓
Garage: 2-car✓
Listed 9.2% below the median closed sale of $770,000. Price per sqft ($382) is a 37% discount to closed comps ($603).
Price Position
Priced below the market — value advantage over the field.
Price advantage
Subject listed at $699K· $382/sqft
Total list price
Closed comps
vs closed median $770K
−$71K (−9.2%)
Active comps
vs active median $749K
−$50K (−6.7%)
Price per sqft
Closed compsinsufficient comp data
Active comps
vs active avg $/sqft $599
−$217 (−36.2%)
Active Properties (5)
Active Comparables
| Address | City | Year | BD | BTH | SqFt | LotSz | LP/SqFt | LP | DIM | Score |
|---|---|---|---|---|---|---|---|---|---|---|
| 349 3rd Street | Montebello | 1923 | 4 | 3 | 1,689 | 6,603 | $443 | $749,000 | 4 | 79 |
| 9651 Kruse | Pico Rivera | 1965 | 4 | 2 | 1,545 | 8,253 | $485 | $749,999 | 18 | 75 |
| 4849 San Gabriel | Pico Rivera | 1941 | 3 | 2 | 1,142 | 4,647 | $665 | $759,000 | 19 | 74 |
| 4753 Orange | Pico Rivera | 1958 | 2 | 1 | 906 | 4,282 | $749 | $679,000 | 46 | 72 |
| 8834 Beverly Boulevard | Pico Rivera | 1939 | 1 | 2 | 935 | 5,510 | $652 | $610,000 | 17 | 71 |
| Total: 5 · Average | 2.8 | 2.0 | 1,243.4 | 5,859 | $598.8 | $709,399.8 | 20.8 | |||
| Median | 1,142 | $749,000 | ||||||||
Closed Properties (5)
Closed Comparables
| Address | City | Year | Date | BD | BTH | SqFt | LotSz | LP | SP | SP/SqFt | SP/LP | DIM | Score |
|---|---|---|---|---|---|---|---|---|---|---|---|---|---|
| 330 Oakmont Drive | Montebello | 1955 | 09/10/2026 | 3 | 2 | 1,704 | 7,040 | $850,000 | $799,150 | $469 | 0.94 | 51 | 88 |
| 4339 Lindell Ave | Pico Rivera | 1952 | 06/08/2026 | 3 | 2 | 1,329 | 6,349 | $749,000 | $750,000 | $564 | 1.00 | 38 | 78 |
| 8841 Ibsen | Pico Rivera | 1921 | 08/11/2026 | 3 | 2 | 962 | 4,608 | $675,000 | $680,000 | $707 | 1.01 | 68 | 74 |
| 425 Valera Drive | Montebello | 1947 | 01/30/2026 | 3 | 1 | 1,104 | 6,363 | $775,000 | $775,000 | $702 | 1.00 | 55 | 74 |
| 4003 Gangel | Pico Rivera | 1949 | 11/24/2025 | 3 | 2 | 1,340 | 7,009 | $769,900 | $770,000 | $575 | 1.00 | 32 | 73 |
| Total: 5 · Average | 3.0 | 1.8 | 1,287.8 | 6,273.8 | $754,830 | $754,830 | $603.4 | — | 48.8 | ||||
| Median | 1,329 | $770,000 | $770,000 | ||||||||||
Market Analysis
List vs Sale $/SqFt
Sale Price Trend
Days on Market
Sale vs List Price
AI-generated CMA
This analysis was generated automatically from MLS data. For an in-depth, human-reviewed valuation, contact Joseph Sardella at josephsardella@gmail.com.