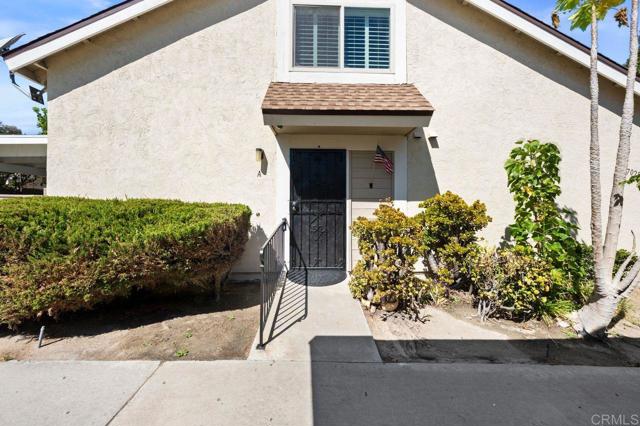
1 / 27
7025 Appian Drive, A, San Diego, CA 92139
$579K3bd · 2ba · 1,224 sqft
Lot 4 sqft•HOA $465/mo•Condominium•Active•19d on market•MLS# 8P-2607731
7025 Appian Drive, A, San Diego, CA 92139
MLS# 8P-2607731•Residential•Condominium
Active19 days on market
$579,000
3
Beds
2
Baths
1,224
Sq Ft
4
Lot Sq Ft
$465
HOA/mo
1981
Year Built
Property Description
Welcome to 7025 Appian Drive, Unit A, San Diego, CA 92139! This inviting 3-bedroom, 2- bathroom home features a covered patio perfect for relaxing or enjoying outdoor gatherings. Conveniently located near major freeways, shopping centers, restaurants, and everyday amenities, this property offers comfort and accessibility in a convenient San Diego location. Don't miss this opportunity to make it your own!
Features & Amenities
FeeBuilt 1981
Property Details
Land Type
Fee
Year Built
1981
Property Type
Residential
Property Subtype
Condominium
Parking Spaces
2
Garage Spaces
0
Cooling
Central Air
City
San Diego
Zip Code
92139
County
San Diego
Mortgage Calculator
Current Rates
$
$
%
Monthly Payment
$2,927.74
Principal & Interest
Loan Amount
$463,200
Total Interest
$590,786
Total Payment Over 30 Years
$1,053,986
This calculator provides estimates only. Actual mortgage payments may include taxes, insurance, HOA fees, and PMI. Contact a lender for accurate quotes.
Comparative Market Analysis
Affordable Tier · 5 active · 5 closed
7025 Appian Drive, A, San Diego, CA 92139
San Diego · Condominium
$579K
Affordable TierBeds
3
Baths
2
Sqft
1,224
Lot
3.59 ac
Year
1981
$/Sqft
$473
Pool: No✓
Spa: No✓
Listed in line with the median closed sale of $580,000.
Price Position
Aligned with the market — fair pricing for the comps.
At market
Subject listed at $579K· $473/sqft
Total list price
Closed comps
vs closed median $580K
−$1K (−0.2%)
Active comps
vs active median $590K
−$11K (−1.9%)
Price per sqft
Closed compsinsufficient comp data
Active comps
vs active avg $/sqft $507
−$34 (−6.8%)
Active Properties (5)
Active Comparables
| Address | City | Year | BD | BTH | SqFt | LotSz | LP/SqFt | LP | DIM | Score |
|---|---|---|---|---|---|---|---|---|---|---|
| 7016 Appian Dr | San Diego | 1980 | 3 | 2 | 1,222 | 130,244 | $491 | $599,900 | 2 | 98 |
| 6987 Parkside Avenue | San Diego | 1981 | 2 | 2 | 1,080 | 428,427 | $546 | $589,999 | 107 | 82 |
| 8773 Spring Canyon Drive | Spring Valley | 1986 | 3 | 3 | 1,226 | 0 | $506 | $619,999 | 79 | 76 |
| 8475 Avenida Anguila | Spring Valley | 1987 | 2 | 2 | 862 | 0 | $579 | $499,000 | 18 | 72 |
| 3804 Willows Way | National City | 1975 | 2 | 2 | 1,350 | 401,231 | $415 | $560,000 | 20 | 71 |
| Total: 5 · Average | 2.4 | 2.2 | 1,148 | 319,967.333 | $507.4 | $573,779.6 | 45.2 | |||
| Median | 1,222 | $589,999 | ||||||||
Closed Properties (5)
Closed Comparables
| Address | City | Year | Date | BD | BTH | SqFt | LotSz | LP | SP | SP/SqFt | SP/LP | DIM | Score |
|---|---|---|---|---|---|---|---|---|---|---|---|---|---|
| 7352 Tooma Street | San Diego | 1981 | 05/15/2026 | 3 | 2 | 1,224 | 0 | $589,000 | $570,000 | $466 | 0.97 | 136 | 93 |
| 6889 Panamint Row | San Diego | 1980 | 04/08/2026 | 3 | 2 | 1,183 | 0 | $589,000 | $585,000 | $495 | 0.99 | 92 | 91 |
| 7007 Appian Drive | San Diego | 1981 | 12/30/2025 | 3 | 3 | 1,222 | 0 | $579,900 | $580,000 | $475 | 1.00 | 67 | 90 |
| 2838 Alta View | San Diego | 1981 | 01/08/2026 | 3 | 2 | 1,178 | 0 | $575,000 | $560,000 | $475 | 0.97 | 38 | 86 |
| 6923 Parkside Avenue | San Diego | 1981 | 09/04/2026 | 3 | 2 | 1,373 | 301,435 | $645,000 | $640,000 | $466 | 0.99 | 79 | 85 |
| Total: 5 · Average | 3.0 | 2.2 | 1,236 | 301,435 | $587,000 | $587,000 | $475.4 | — | 82.4 | ||||
| Median | 1,222 | $580,000 | $580,000 | ||||||||||
Market Analysis
List vs Sale $/SqFt
Sale Price Trend
Days on Market
Sale vs List Price
AI-generated CMA
This analysis was generated automatically from MLS data. For an in-depth, human-reviewed valuation, contact Joseph Sardella at josephsardella@gmail.com.