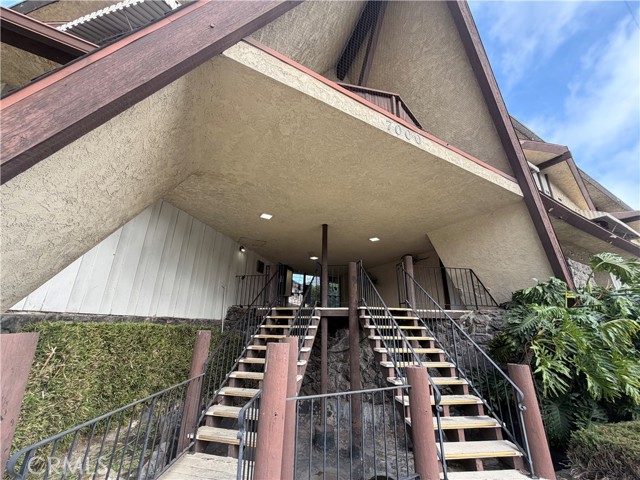
7000 S. La Cienega Blvd. South, 29, Inglewood, CA 90302
7000 S. La Cienega Blvd. South, 29, Inglewood, CA 90302
Property Description
RATE RELIEF AVAILABLE! Seller willing to provide a credit toward a buyer interest rate buy-down to significantly lower your monthly mortgage payment. Ask your agent for details! NEWLY RENOVATED!! Corner top floor, end unit unique space offering one of the larger floor plans, half bath on entry level, private patio balcony with a neighborhood view, gated community, and garage parking. Quiet, common areas, grounds are well maintained with connected community feel! Centrally located, close to Kia Forum, SoFi Stadium, Entertainment, Grocery stores, LAX airport, and schools. Easy access to Hollywood Park, restaurants, and shopping! It's turn key and move-in ready!
Features & Amenities
Property Details
Mortgage Calculator
Current Rates
Comparative Market Analysis
Affordable Tier · 5 active · 5 closed
Inglewood · Condominium
Listed in line with the median closed sale of $449,000. Closed comps sold at 101% of list — strong seller's market.
Price Position
Aligned with the market — fair pricing for the comps.
Active Properties (5)
Active Comparables
| Address | City | Year | BD | BTH | SqFt | LotSz | LP/SqFt | LP | DIM | Score |
|---|---|---|---|---|---|---|---|---|---|---|
| 500 Evergreen | Inglewood | 1965 | 2 | 2 | 906 | 29,133 | $464 | $420,000 | 47 | 91 |
| 855 Victor Avenue | Inglewood | 1964 | 2 | 2 | 926 | 0 | $528 | $489,000 | 106 | 89 |
| 933 Cedar | Inglewood | 1973 | 2 | 2 | 1,136 | 23,878 | $436 | $495,300 | 68 | 88 |
| 805 Glenway Drive | Inglewood | 1964 | 2 | 2 | 943 | 49,676 | $477 | $450,000 | 8 | 86 |
| 610 Venice | Inglewood | 1990 | 2 | 2 | 869 | 28,718 | $541 | $470,000 | 6 | 85 |
| Total: 5 · Average | 2.0 | 2.0 | 956 | 32,851.25 | $489.2 | $464,860 | 47 | |||
| Median | 926 | $470,000 | ||||||||
Closed Properties (5)
Closed Comparables
| Address | City | Year | Date | BD | BTH | SqFt | LotSz | LP | SP | SP/SqFt | SP/LP | DIM | Score |
|---|---|---|---|---|---|---|---|---|---|---|---|---|---|
| 7000 La Cienega Boulevard | Inglewood | 1963 | 08/31/2026 | 2 | 2 | 1,105 | 27,214 | $450,000 | $455,000 | $412 | 1.01 | 190 | 94 |
| 805 Industrial | Inglewood | 1972 | 08/17/2026 | 2 | 2 | 1,118 | 30,778 | $470,000 | $480,000 | $429 | 1.02 | 96 | 92 |
| 913 Victor | Inglewood | 1964 | 09/25/2026 | 2 | 2 | 799 | 22,821 | $395,000 | $405,000 | $507 | 1.02 | 82 | 91 |
| 933 Cedar Street | Inglewood | 1973 | 02/04/2026 | 2 | 2 | 1,052 | 23,878 | $429,999 | $429,999 | $409 | 1.00 | 167 | 88 |
| 614 Venice Way | Inglewood | 1990 | 07/08/2026 | 2 | 2 | 1,019 | 0 | $449,000 | $449,000 | $441 | 1.00 | 34 | 86 |
| Total: 5 · Average | 2.0 | 2.0 | 1,018.6 | 26,172.75 | $443,799.8 | $443,799.8 | $439.6 | — | 113.8 | ||||
| Median | 1,052 | $449,000 | $449,000 | ||||||||||
Market Analysis
List vs Sale $/SqFt
Sale Price Trend
Days on Market
Sale vs List Price
This analysis was generated automatically from MLS data. For an in-depth, human-reviewed valuation, contact Joseph Sardella at josephsardella@gmail.com.