658 North Milford, Orange, CA 92867
658 North Milford, Orange, CA 92867
Property Description
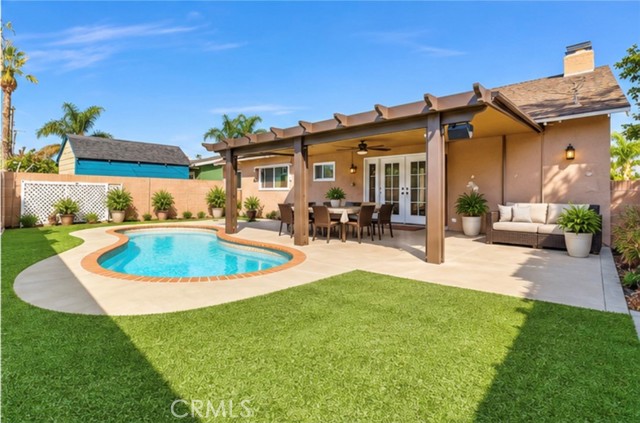
PRIDE OWNERSHIP, over 6,000 square foot corner lot and no landscaper is needed due to the beautifully maintained lush artificial turf. this is worry free upkeep. the 4-bedroom 2 bath home offers a blend of comfort and style. inviting open floorplan where the dining room meets the kitchen, freshly painted, recessed lighting throughout, cozy gas fireplace, hardwood flooring, dual pane windows and recessed lighting. the modern kitchen boasts a stainless-steel appliances, wall to wall cabinets, drawers include lazy Susans, ample of counter space and a Caesarstone island that could be used as a breakfast nook. dining leads to the outside custom-made patio cover and sparkling fiberglass pool. bedrooms feature generous space and an easy access to the inside laundry closet. restrooms have great space and include design tile and walk-up attic. this home is a handicap accessible, located in the desirable area of orange, minutes from the historical downtown orange and so close to freeways and shopping.
Features & Amenities
Property Details
Mortgage Calculator
Current Rates
Comparative Market Analysis
Residential Tier · 5 active · 5 closed
Orange · Single Family Residence
Listed 3.8% below the median closed sale of $1,300,000. Closed comps sold at 101% of list — strong seller's market.
Price Position
Aligned with the market — fair pricing for the comps.
Active Properties (5)
Active Comparables
| Address | City | Year | BD | BTH | SqFt | LotSz | LP/SqFt | LP | DIM | Score |
|---|---|---|---|---|---|---|---|---|---|---|
| 446 Park Lane | Orange | 1956 | 3 | 2 | 1,548 | 6,175 | $742 | $1.15M | 42 | 92 |
| 592 Milford | Orange | 1955 | 3 | 2 | 1,500 | 7,148 | $767 | $1.15M | 157 | 90 |
| 721 Milford Road | Orange | 1959 | 3 | 2 | 1,517 | 6,324 | $757 | $1.15M | 67 | 83 |
| 515 Wayfield | Orange | 1955 | 4 | 2 | 1,313 | 6,000 | $829 | $1.09M | 47 | 81 |
| 340 Wayfield | Orange | 1957 | 3 | 2 | 1,491 | 7,186 | $889 | $1.32M | 16 | 79 |
| Total: 5 · Average | 3.2 | 2.0 | 1,473.8 | 6,566.6 | $796.8 | $1.17M | 65.8 | |||
| Median | 1,500 | $1.15M | ||||||||
Closed Properties (5)
Closed Comparables
| Address | City | Year | Date | BD | BTH | SqFt | LotSz | LP | SP | SP/SqFt | SP/LP | DIM | Score |
|---|---|---|---|---|---|---|---|---|---|---|---|---|---|
| 1920 Barkley | Orange | 1959 | 05/02/2026 | 4 | 2 | 1,732 | 6,600 | $1.40M | $1.38M | $794 | 0.99 | 50 | 91 |
| 526 Handy | Orange | 1955 | 07/10/2026 | 3 | 2 | 1,567 | 7,201 | $1.10M | $1.08M | $692 | 0.99 | 42 | 91 |
| 2543 Locust | Orange | 1960 | 07/17/2026 | 3 | 3 | 1,792 | 6,000 | $1.40M | $1.39M | $773 | 0.99 | 66 | 87 |
| 2712 Jacaranda Avenue | Orange | 1963 | 06/09/2026 | 4 | 2 | 1,600 | 6,000 | $1.20M | $1.30M | $812 | 1.08 | 29 | 84 |
| 401 Sacramento Street | Orange | 1964 | 07/29/2026 | 4 | 3 | 1,654 | 6,000 | $1.15M | $1.18M | $713 | 1.03 | 22 | 82 |
| Total: 5 · Average | 3.6 | 2.4 | 1,669 | 6,360.2 | $1.26M | $1.26M | $756.8 | — | 41.8 | ||||
| Median | 1,654 | $1.30M | $1.30M | ||||||||||
Market Analysis
List vs Sale $/SqFt
Sale Price Trend
Days on Market
Sale vs List Price
This analysis was generated automatically from MLS data. For an in-depth, human-reviewed valuation, contact Joseph Sardella at josephsardella@gmail.com.