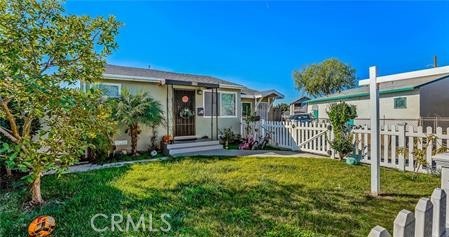
6546 Foster Bridge, Bell Gardens, CA 90201
6546 Foster Bridge, Bell Gardens, CA 90201
Property Description
Welcome to this beautifully maintained 3 bedrooms 1 bath resident nestled in the heart of Bell Gardens. Offering a rare opportunity in a neighborhood where homes seldom come to market, this property features 1,128 square feet of thoughtfully designed living space on a 3,506 square foot lot. The home includes a private 238 square foot ADU ideal for guests, extended family, or supplemental income. The remodeled kitchen showcases modern finishes and flows seamlessly into the living area while the bedrooms are spacious and inviting, providing comfort and versatility. This exceptional property combines charm, functionality, and exclusivity in a highly desirable location.
Features & Amenities
Property Details
Mortgage Calculator
Current Rates
Comparative Market Analysis
Affordable Tier · 5 active · 5 closed
Bell Gardens · Single Family Residence
Listed 6.9% below the median closed sale of $768,000. Price per sqft ($634) is a 10% discount to closed comps ($706). Closed comps sold at 101% of list — strong seller's market.
Price Position
Priced below the market — value advantage over the field.
Active Properties (5)
Active Comparables
| Address | City | Year | BD | BTH | SqFt | LotSz | LP/SqFt | LP | DIM | Score |
|---|---|---|---|---|---|---|---|---|---|---|
| 6546 Fry | Bell Gardens | 1940 | 3 | 1 | 960 | 7,553 | $833 | $800,000 | 87 | 83 |
| 8241 Elmont | Pico Rivera | 1950 | 3 | 2 | 1,261 | 5,062 | $583 | $735,000 | 25 | 75 |
| 8320 Terradell Street | Pico Rivera | 1950 | 3 | 2 | 1,114 | 7,445 | $699 | $779,000 | 86 | 73 |
| 8273 Samoline | Pico Rivera | 1950 | 2 | 1 | 862 | 5,658 | $812 | $699,900 | 33 | 72 |
| 8263 Brookgreen | Downey | 1949 | 2 | 1 | 713 | 4,998 | $915 | $652,500 | 8 | 68 |
| Total: 5 · Average | 2.6 | 1.4 | 982 | 6,143.2 | $768.4 | $733,280 | 47.8 | |||
| Median | 960 | $735,000 | ||||||||
Closed Properties (5)
Closed Comparables
| Address | City | Year | Date | BD | BTH | SqFt | LotSz | LP | SP | SP/SqFt | SP/LP | DIM | Score |
|---|---|---|---|---|---|---|---|---|---|---|---|---|---|
| 5952 Priory | Bell Gardens | 1947 | 10/14/2026 | 3 | 1 | 1,052 | 5,150 | $719,998 | $710,000 | $675 | 0.99 | 86 | 83 |
| 7326 Glencliff Drive | Downey | 1953 | 09/10/2026 | 3 | 2 | 1,207 | 6,925 | $749,000 | $815,000 | $675 | 1.09 | 43 | 79 |
| 9714 Paramount | Downey | 1948 | 09/02/2026 | 3 | 1 | 1,050 | 6,455 | $799,900 | $820,000 | $781 | 1.02 | 49 | 78 |
| 8635 Paramount Blvd | Downey | 1951 | 09/15/2026 | 3 | 1 | 1,006 | 8,360 | $745,000 | $768,000 | $763 | 1.03 | 34 | 78 |
| 8548 Paramount Boulevard | Downey | 1950 | 06/02/2026 | 3 | 1 | 1,094 | 5,327 | $749,950 | $695,622 | $636 | 0.93 | 49 | 77 |
| Total: 5 · Average | 3.0 | 1.2 | 1,081.8 | 6,443.4 | $761,724.4 | $761,724.4 | $706 | — | 52.2 | ||||
| Median | 1,052 | $768,000 | $768,000 | ||||||||||
Market Analysis
List vs Sale $/SqFt
Sale Price Trend
Days on Market
Sale vs List Price
This analysis was generated automatically from MLS data. For an in-depth, human-reviewed valuation, contact Joseph Sardella at josephsardella@gmail.com.