1 / 16
617 East Carroll, Glendora, CA 91741
$760K3bd · 2ba · 1,691 sqft
Lot 10,984 sqft•Single Family Residence•Active•7d on market•MLS# PW-26228017
617 East Carroll, Glendora, CA 91741
MLS# PW-26228017•Residential•Single Family Residence
Active7 days on market
$760,000
3
Beds
2
Baths
1,691
Sq Ft
10,984
Lot Sq Ft
1953
Year Built
None
View
Property Description
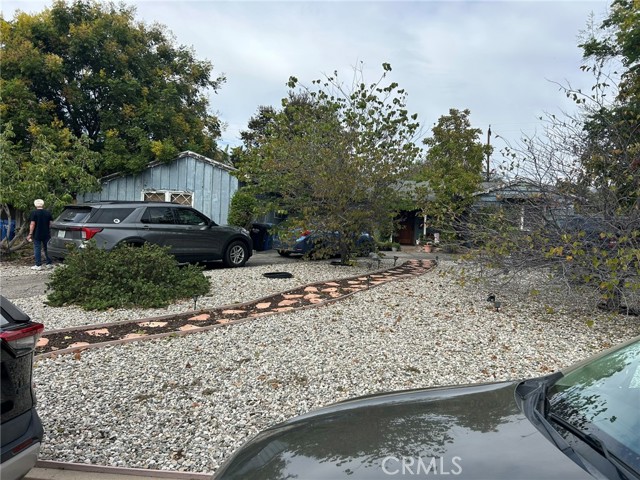
Diamond in the Rough: Great bones needs TLC and modern updates. Sold strictly as-is with rehabilitation considerations factored into the aggressive pricing. Excellent footprint in a desirable neighborhood, but needs complete cosmetic & mechanical updates. Cash offers strongly preferred.
Features & Amenities
FeeBuilt 1953
Property Details
Land Type
Fee
Year Built
1953
Property Type
Residential
Property Subtype
Single Family Residence
Parking Spaces
2
Garage Spaces
2
Heating
Central
Cooling
Central Air
View
None
City
Glendora
Zip Code
91741
County
Los Angeles
Mortgage Calculator
Current Rates
$
$
%
Monthly Payment
$3,842.97
Principal & Interest
Loan Amount
$608,000
Total Interest
$775,470
Total Payment Over 30 Years
$1,383,470
This calculator provides estimates only. Actual mortgage payments may include taxes, insurance, HOA fees, and PMI. Contact a lender for accurate quotes.
Comparative Market Analysis
Residential Tier · 5 active · 5 closed
617 East Carroll, Glendora, CA 91741
Glendora · Single Family Residence
$760K
Residential TierBeds
3
Baths
2
Sqft
1,691
Lot
10,984 sqft
Year
1953
$/Sqft
$449
Pool: Yes✓
View: None✓
Garage: 2-car✓
Listed 5.6% below the median closed sale of $805,000. Price per sqft ($449) is a 28% discount to closed comps ($624). Closed comps sold at 102% of list — strong seller's market.
Price Position
Priced below the market — value advantage over the field.
Price advantage
Subject listed at $760K· $449/sqft
Total list price
Closed comps
vs closed median $805K
−$45K (−5.6%)
Active comps
vs active median $725K
+$35K (+4.8%)
Price per sqft
Closed compsinsufficient comp data
Active comps
vs active avg $/sqft $581
−$132 (−22.7%)
Active Properties (5)
Active Comparables
| Address | City | Year | BD | BTH | SqFt | LotSz | LP/SqFt | LP | DIM | Score |
|---|---|---|---|---|---|---|---|---|---|---|
| 449 Mauna Loa | Glendora | 1955 | 4 | 2 | 1,300 | 6,507 | $558 | $725,000 | 4 | 83 |
| 643 Foothill Boulevard | Glendora | 1951 | 3 | 1 | 987 | 10,010 | $707 | $698,000 | 3 | 76 |
| 422 Ada Avenue | Glendora | 1954 | 3 | 2 | 1,511 | 6,174 | $562 | $849,900 | 17 | 75 |
| 347 Leeside | Glendora | 1954 | 2 | 2 | 1,508 | 6,290 | $564 | $849,800 | 47 | 73 |
| 502 Leeside | Glendora | 1953 | 3 | 2 | 1,264 | 6,365 | $514 | $650,000 | 5 | 72 |
| Total: 5 · Average | 3.0 | 1.8 | 1,314 | 7,069.2 | $581 | $754,540 | 15.2 | |||
| Median | 1,300 | $725,000 | ||||||||
Closed Properties (5)
Closed Comparables
| Address | City | Year | Date | BD | BTH | SqFt | LotSz | LP | SP | SP/SqFt | SP/LP | DIM | Score |
|---|---|---|---|---|---|---|---|---|---|---|---|---|---|
| 727 Mountain View Avenue | Glendora | 1953 | 05/22/2026 | 2 | 2 | 1,371 | 10,914 | $699,000 | $760,000 | $554 | 1.09 | 18 | 83 |
| 450 Sycamore Avenue | Glendora | 1952 | 08/13/2026 | 3 | 2 | 1,347 | 8,863 | $799,000 | $810,000 | $601 | 1.01 | 45 | 80 |
| 943 Foothill Boulevard | Glendora | 1957 | 12/19/2025 | 3 | 2 | 1,520 | 9,957 | $848,000 | $861,000 | $566 | 1.01 | 401 | 76 |
| 711 Foothill | Glendora | 1949 | 07/28/2026 | 3 | 1 | 1,100 | 9,725 | $789,000 | $780,000 | $709 | 0.99 | 31 | 75 |
| 116 Wabash | Glendora | 1947 | 09/14/2026 | 3 | 1 | 1,166 | 6,423 | $799,800 | $805,000 | $690 | 1.01 | 56 | 71 |
| Total: 5 · Average | 2.8 | 1.6 | 1,300.8 | 9,176.4 | $803,200 | $803,200 | $624 | — | 110.2 | ||||
| Median | 1,347 | $805,000 | $805,000 | ||||||||||
Market Analysis
List vs Sale $/SqFt
Sale Price Trend
Days on Market
Sale vs List Price
AI-generated CMA
This analysis was generated automatically from MLS data. For an in-depth, human-reviewed valuation, contact Joseph Sardella at josephsardella@gmail.com.