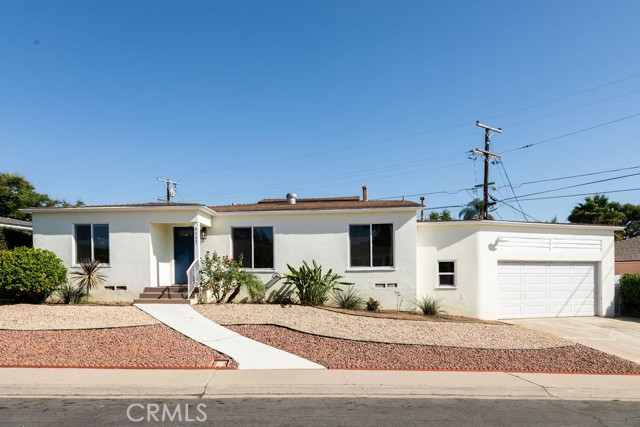
6117 Mesita Drive, San Diego, CA 92115
6117 Mesita Drive, San Diego, CA 92115
Property Description
Updated, bright, and welcoming single-family home near SDSU! This charming residence features newly painted interiors and freshly refurbished hardwood floors that bring warmth and character throughout. Newer windows allow for abundant natural light while enhancing energy efficiency. Outside, enjoy a beautifully landscaped front yard with vibrant curb appeal. Features fresh paint, refurbished hardwood floors, newer windows & a newly landscaped front lawn. Close to dining & transit
Features & Amenities
Property Details
Mortgage Calculator
Current Rates
About San Diego
This property is located in San Diego, a community in San Diego. Explore more listings in this neighborhood to compare options and pricing.
View San Diego ListingsComparative Market Analysis
Residential Tier · 5 active · 5 closed
San Diego · San Diego · Single Family Residence
Listed 7.6% above the median closed sale of $1,299,888. Price per sqft ($716) is a 24% discount to closed comps ($941).
Price Position
Positioned above the market — commands a premium.
Active Properties (5)
Active Comparables
| Address | City | Year | BD | BTH | SqFt | LotSz | LP/SqFt | LP | DIM | Score |
|---|---|---|---|---|---|---|---|---|---|---|
| 4922 64th | San Diego | 1952 | 8 | 4 | 2,450 | 5,100 | $633 | $1.55M | 76 | 81 |
| 4911 Campanile Drive | San Diego | 1958 | 4 | 3 | 1,843 | 6,970 | $705 | $1.30M | 44 | 74 |
| 5996 College | San Diego | 1970 | 4 | 3 | 2,104 | 7,000 | $703 | $1.48M | 16 | 65 |
| 5693 Easton Avenue | San Diego | 1957 | 4 | 2 | 1,693 | 6,534 | $725 | $1.23M | 80 | 64 |
| 6461 Hillgrove | San Diego | 1960 | 4 | 2 | 2,013 | 9,400 | $726 | $1.46M | 2 | 64 |
| Total: 5 · Average | 4.8 | 2.8 | 2,020.6 | 7,000.8 | $698.4 | $1.40M | 43.6 | |||
| Median | 2,013 | $1.46M | ||||||||
Closed Properties (5)
Closed Comparables
| Address | City | Year | Date | BD | BTH | SqFt | LotSz | LP | SP | SP/SqFt | SP/LP | DIM | Score |
|---|---|---|---|---|---|---|---|---|---|---|---|---|---|
| 6034 Lancaster Drive | San Diego | 1959 | 10/23/2026 | 3 | 2 | 1,748 | 7,500 | $1.30M | $1.30M | $743 | 1.00 | 29 | 68 |
| 4985 Lucille Drive | San Diego | 1950 | 09/24/2026 | 3 | 2 | 1,325 | 5,800 | $1.30M | $1.30M | $981 | 1.00 | 43 | 66 |
| 4985 Lucille Drive | San Diego | 1950 | 09/24/2026 | 3 | 2 | 1,325 | 5,800 | $1.45M | $1.30M | $981 | 0.90 | 70 | 66 |
| 4769 50th Street | San Diego | 1947 | 10/20/2026 | 3 | 2 | 1,176 | 5,000 | $1.25M | $1.24M | $1,054 | 0.99 | 67 | 65 |
| 4661 50Th Street | San Diego | 1931 | 07/13/2026 | 3 | 2 | 1,691 | 4,792 | $1.60M | $1.60M | $946 | 1.00 | 125 | 65 |
| Total: 5 · Average | 3.0 | 2.0 | 1,453 | 5,778.4 | $1.35M | $1.35M | $941 | — | 66.8 | ||||
| Median | 1,325 | $1.30M | $1.30M | ||||||||||
Market Analysis
List vs Sale $/SqFt
Sale Price Trend
Days on Market
Sale vs List Price
This analysis was generated automatically from MLS data. For an in-depth, human-reviewed valuation, contact Joseph Sardella at josephsardella@gmail.com.