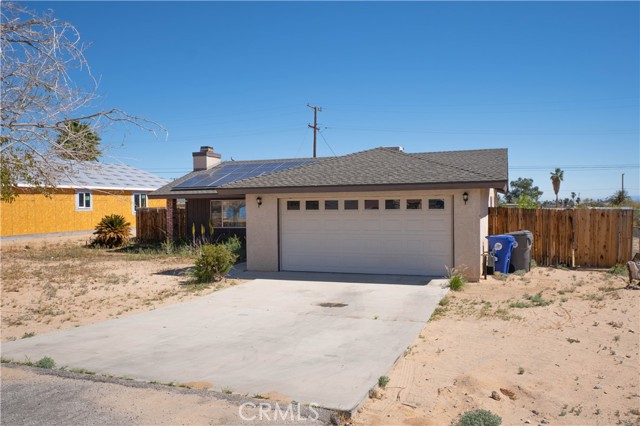
1 / 59
6039 Encelia, 29 Palms, CA 92277
$319K3bd · 2ba · 1,200 sqft
Lot 10,220 sqft•Single Family Residence•Active•231d on market•MLS# PW-26056232
6039 Encelia, 29 Palms, CA 92277
MLS# PW-26056232•Residential•Single Family Residence
Active231 days on market
$319,000
3
Beds
2
Baths
1,200
Sq Ft
10,220
Lot Sq Ft
1990
Year Built
Desert
View
Property Description
Nestled in a desirable 29 Palms neighborhood, this home puts you minutes from the Marine Corps base and from shopping, dining, and schools. Easy access to the area’s most popular spots and a genuine chance to own something special in a neighborhood people want.
Features & Amenities
FeeBuilt 1990
Property Details
Land Type
Fee
Year Built
1990
Property Type
Residential
Property Subtype
Single Family Residence
Parking Spaces
2
Garage Spaces
2
Cooling
Evaporative Cooling
View
Desert
City
29 Palms
Zip Code
92277
County
San Bernardino
Mortgage Calculator
Current Rates
$
$
%
Monthly Payment
$1,613.04
Principal & Interest
Loan Amount
$255,200
Total Interest
$325,494
Total Payment Over 30 Years
$580,694
This calculator provides estimates only. Actual mortgage payments may include taxes, insurance, HOA fees, and PMI. Contact a lender for accurate quotes.
Comparative Market Analysis
Affordable Tier · 5 active · 5 closed
6039 Encelia, 29 Palms, CA 92277
29 Palms · Single Family Residence
$319K
Affordable TierBeds
3
Baths
2
Sqft
1,200
Lot
10,220 sqft
Year
1990
$/Sqft
$266
Pool: No✓
View: desert✓
Garage: 2-car✓
Listed in line with the median closed sale of $325,000. Price per sqft ($266) is a 16% premium to closed comps ($229). Expect a longer timeline — comps averaged 144 days on market.
Price Position
Aligned with the market — fair pricing for the comps.
At market
Subject listed at $319K· $266/sqft
Total list price
Closed comps
vs closed median $325K
−$6K (−1.8%)
Active comps
vs active median $289K
+$30K (+10.4%)
Price per sqft
Closed compsinsufficient comp data
Active comps
vs active avg $/sqft $232
+$34 (+14.5%)
Active Properties (5)
Active Comparables
| Address | City | Year | BD | BTH | SqFt | LotSz | LP/SqFt | LP | DIM | Score |
|---|---|---|---|---|---|---|---|---|---|---|
| 6178 Baileya | 29 Palms | 1985 | 3 | 2 | 1,252 | 7,200 | $231 | $288,900 | 5 | 92 |
| 5656 Daisy | 29 Palms | 1978 | 4 | 2 | 1,225 | 8,515 | $228 | $279,900 | 26 | 87 |
| 6119 Cahuilla Avenue | 29 Palms | 2007 | 3 | 2 | 1,131 | 7,200 | $247 | $279,900 | 48 | 87 |
| 6166 Mariposa Avenue | 29 Palms | 2005 | 3 | 2 | 1,380 | 7,200 | $232 | $320,000 | 80 | 84 |
| 71643 Sunnyvale Court | 29 Palms | 2005 | 3 | 2 | 1,604 | 8,890 | $224 | $360,000 | 120 | 83 |
| Total: 5 · Average | 3.2 | 2.0 | 1,318.4 | 7,801 | $232.4 | $305,740 | 55.8 | |||
| Median | 1,252 | $288,900 | ||||||||
Closed Properties (5)
Closed Comparables
| Address | City | Year | Date | BD | BTH | SqFt | LotSz | LP | SP | SP/SqFt | SP/LP | DIM | Score |
|---|---|---|---|---|---|---|---|---|---|---|---|---|---|
| 5982 Morongo Road | 29 Palms | 2006 | 09/23/2026 | 3 | 2 | 1,200 | 7,208 | $275,000 | $275,000 | $229 | 1.00 | 33 | 88 |
| 6012 Regino | 29 Palms | 2005 | 06/08/2026 | 3 | 2 | 1,314 | 7,547 | $339,899 | $342,000 | $260 | 1.01 | 95 | 86 |
| 6218 Daisy | 29 Palms | 2006 | 07/21/2026 | 3 | 2 | 1,467 | 8,400 | $325,000 | $325,000 | $222 | 1.00 | 39 | 84 |
| 71502 Florida Drive | 29 Palms | 2005 | 02/03/2026 | 3 | 2 | 1,314 | 10,794 | $315,000 | $300,000 | $228 | 0.95 | 186 | 83 |
| 71578 Florida Drive | 29 Palms | 2005 | 05/15/2026 | 3 | 2 | 1,604 | 8,125 | $332,400 | $327,000 | $204 | 0.98 | 365 | 81 |
| Total: 5 · Average | 3.0 | 2.0 | 1,379.8 | 8,414.8 | $313,800 | $313,800 | $228.6 | — | 143.6 | ||||
| Median | 1,314 | $325,000 | $325,000 | ||||||||||
Market Analysis
List vs Sale $/SqFt
Sale Price Trend
Days on Market
Sale vs List Price
AI-generated CMA
This analysis was generated automatically from MLS data. For an in-depth, human-reviewed valuation, contact Joseph Sardella at josephsardella@gmail.com.