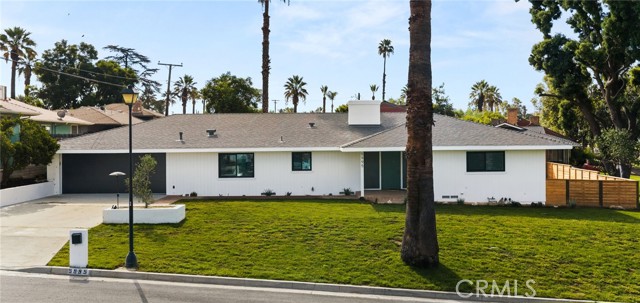
5995 Londonderry Drive, Riverside, CA 92504
5995 Londonderry Drive, Riverside, CA 92504
Property Description
5995 Londonderry Drive in Riverside, California delivers authentic mid-century modern style with a complete modern transformation. This single-story 3-bedroom home features a flowing layout, new windows, new air conditioning, a fully remodeled kitchen, and beautifully updated bathrooms. Attached mother-in-law quarters add exceptional flexibility with a private entrance, kitchenette, bedroom, and bathroom, ideal for multigenerational living, guests, a private office, or potential rental use. Set on a large corner lot with an expansive front yard and private backyard, the property offers space inside and out. Located near Riverside schools, shopping, dining, and everyday conveniences, this turnkey home blends character, craftsmanship, and modern functionality in one complete package.
Features & Amenities
Property Details
Mortgage Calculator
Current Rates
Comparative Market Analysis
Residential Tier · 5 active · 5 closed
Riverside · Single Family Residence
Listed 11.7% above the median closed sale of $715,000. Closed comps sold at 101% of list — strong seller's market.
Price Position
Positioned above the market — commands a premium.
Active Properties (5)
Active Comparables
| Address | City | Year | BD | BTH | SqFt | LotSz | LP/SqFt | LP | DIM | Score |
|---|---|---|---|---|---|---|---|---|---|---|
| 6191 Streeter Ave Avenue | Riverside | 1960 | 3 | 2 | 1,763 | 7,841 | $406 | $714,900 | 53 | 85 |
| 4963 Carlingford Avenue | Riverside | 1965 | 4 | 2 | 1,821 | 6,970 | $384 | $699,900 | 156 | 84 |
| 5425 Golden West | Riverside | 1968 | 3 | 3 | 2,103 | 9,148 | $340 | $714,999 | 4 | 77 |
| 6395 Brockton | Riverside | 1927 | 3 | 2 | 1,916 | 7,841 | $404 | $775,000 | 69 | 77 |
| 4061 Maplewood pl | Riverside | 1953 | 3 | 2 | 1,555 | 8,276 | $488 | $759,000 | 261 | 75 |
| Total: 5 · Average | 3.2 | 2.2 | 1,831.6 | 8,015.2 | $404.4 | $732,759.8 | 108.6 | |||
| Median | 1,821 | $714,999 | ||||||||
Closed Properties (5)
Closed Comparables
| Address | City | Year | Date | BD | BTH | SqFt | LotSz | LP | SP | SP/SqFt | SP/LP | DIM | Score |
|---|---|---|---|---|---|---|---|---|---|---|---|---|---|
| 5830 Old Ranch Road | Riverside | 1964 | 07/08/2026 | 3 | 2 | 1,709 | 10,454 | $689,900 | $730,000 | $427 | 1.06 | 40 | 88 |
| 5470 Greenbrier Dr | Riverside | 1959 | 06/18/2026 | 3 | 2 | 1,532 | 8,276 | $685,000 | $688,888 | $450 | 1.01 | 38 | 83 |
| 5635 Tower Road | Riverside | 1956 | 11/20/2025 | 3 | 2 | 1,892 | 8,712 | $699,000 | $700,000 | $370 | 1.00 | 45 | 83 |
| 5382 Tower | Riverside | 1959 | 05/29/2026 | 4 | 2 | 1,827 | 9,148 | $728,900 | $715,000 | $391 | 0.98 | 79 | 80 |
| 5822 Old Ranch Road | Riverside | 1976 | 05/29/2026 | 3 | 3 | 2,226 | 11,325 | $784,900 | $785,000 | $353 | 1.00 | 68 | 78 |
| Total: 5 · Average | 3.2 | 2.2 | 1,837.2 | 9,583 | $723,777.6 | $723,777.6 | $398.2 | — | 54 | ||||
| Median | 1,827 | $715,000 | $715,000 | ||||||||||
Market Analysis
List vs Sale $/SqFt
Sale Price Trend
Days on Market
Sale vs List Price
This analysis was generated automatically from MLS data. For an in-depth, human-reviewed valuation, contact Joseph Sardella at josephsardella@gmail.com.