5951 Canterbury Drive, 20, Culver City, CA 90230
5951 Canterbury Drive, 20, Culver City, CA 90230
Property Description
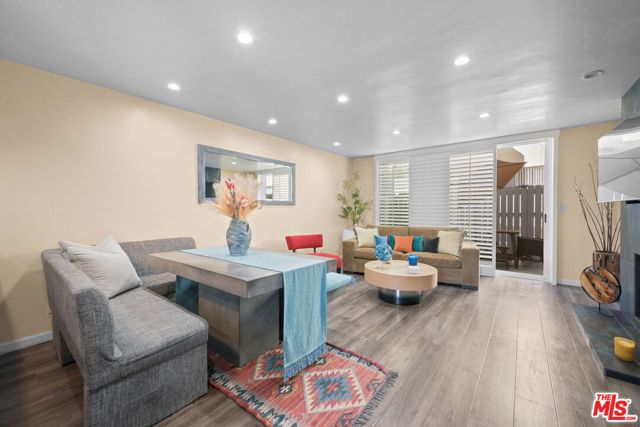
Welcome to 5951 Canterbury Drive #20, a rare corner end-unit in the highly desirable Los Cerros Townhomes of Culver City. This beautifully remodeled two-story townhouse offers 2 bedrooms and 1.5 bathrooms with no neighbors above or below with only one common wall, blending privacy with comfort. The open-concept layout features engineered hardwood floors, recessed lighting, a ceramic electric fireplace with a pull-out TV unit, and a seamless flow between the living, dining, and kitchen areas. A sliding glass door opens to a private patio, perfect for enjoying fresh air and al fresco dining. The fully updated kitchen boasts high-gloss lacquered cabinetry, quartz countertops, ceramic tile flooring, and stainless steel appliances including a refrigerator, microwave, dishwasher, and drop-in oven with stovetop. Upstairs, both bedrooms are spacious and filled with natural light, complemented by energy-efficient windows and modern remodeled bathrooms. Additional highlights include custom wooden railings, new plumbing, a tankless water heater, alarm system, and two side-by-side parking spaces with storage in the secured underground garage. Enjoy community amenities like a heated pool and easy access to Culver City's best dining, shopping, and entertainment all while tucked away in a peaceful, well-maintained neighborhood.
Features & Amenities
Property Details
Mortgage Calculator
Current Rates
Comparative Market Analysis
Affordable Tier · 5 active · 5 closed
Culver City · Townhouse
Listed 4.2% above the median closed sale of $575,000. Price per sqft ($616) is a 38% premium to closed comps ($447). Closed comps sold at 101% of list — strong seller's market. Expect a longer timeline — comps averaged 163 days on market.
Price Position
Aligned with the market — fair pricing for the comps.
Active Properties (5)
Active Comparables
| Address | City | Year | BD | BTH | SqFt | LotSz | LP/SqFt | LP | DIM | Score |
|---|---|---|---|---|---|---|---|---|---|---|
| 532 Venice Way | Inglewood | 1989 | 2 | 2 | 1,320 | 24,065 | $416 | $549,000 | 34 | 67 |
| 620 Hyde Park | Inglewood | 1983 | 2 | 2 | 1,149 | 65,895 | $474 | $545,000 | 98 | 66 |
| 4567 Don Ricardo Drive | Los Angeles | 1961 | 2 | 2 | 1,221 | 14,078 | $491 | $599,995 | 33 | 63 |
| 534 Hazel Street | Inglewood | 1981 | 2 | 3 | 1,177 | 13,083 | $476 | $560,000 | 11 | 62 |
| 515 Hazel | Inglewood | 1988 | 3 | 2 | 1,288 | 20,006 | $446 | $575,000 | 22 | 59 |
| Total: 5 · Average | 2.2 | 2.2 | 1,231 | 27,425.4 | $460.6 | $565,799 | 39.6 | |||
| Median | 1,221 | $560,000 | ||||||||
Closed Properties (5)
Closed Comparables
| Address | City | Year | Date | BD | BTH | SqFt | LotSz | LP | SP | SP/SqFt | SP/LP | DIM | Score |
|---|---|---|---|---|---|---|---|---|---|---|---|---|---|
| 5300 Fairview | Los Angeles | 1969 | 08/27/2026 | 2 | 3 | 1,182 | 30,481 | $599,900 | $600,000 | $508 | 1.00 | 96 | 76 |
| 532 Venice Way | Inglewood | 1989 | 11/18/2025 | 2 | 2 | 1,320 | 24,065 | $559,000 | $550,000 | $417 | 0.98 | 170 | 61 |
| 323 Plymouth Street | Inglewood | 1980 | 01/22/2026 | 2 | 2 | 1,268 | 11,575 | $549,000 | $565,000 | $446 | 1.03 | 224 | 59 |
| 620 Hyde Park Boulevard | Inglewood | 1983 | 12/11/2025 | 3 | 2 | 1,415 | 65,877 | $575,000 | $575,000 | $406 | 1.00 | 119 | 50 |
| 916 65th Street | Inglewood | 1988 | 12/18/2025 | 3 | 3 | 1,380 | 22,652 | $609,900 | $630,000 | $457 | 1.03 | 208 | 46 |
| Total: 5 · Average | 2.4 | 2.4 | 1,313 | 30,930 | $584,000 | $584,000 | $446.8 | — | 163.4 | ||||
| Median | 1,320 | $575,000 | $575,000 | ||||||||||
Market Analysis
List vs Sale $/SqFt
Sale Price Trend
Days on Market
Sale vs List Price
This analysis was generated automatically from MLS data. For an in-depth, human-reviewed valuation, contact Joseph Sardella at josephsardella@gmail.com.