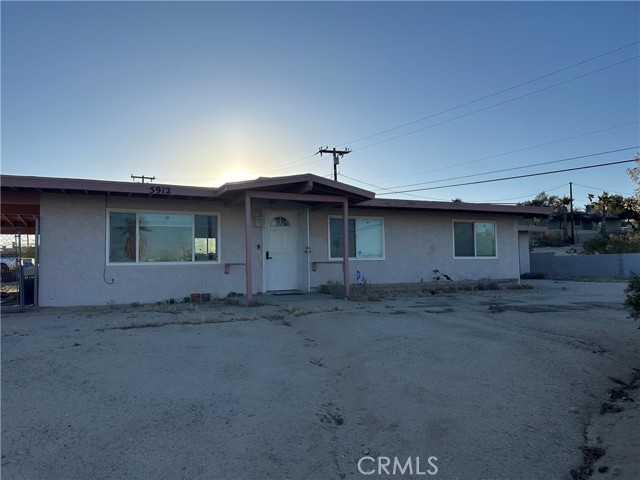
5912 Bagley Avenue, 29 Palms, CA 92277
5912 Bagley Avenue, 29 Palms, CA 92277
Property Description
Welcome to this charming and move-in ready home in the City of 29 Palms! This spacious, updated 3-bedroom, 2-bath property features an open layout, remodeled kitchen and bathrooms, offering modern finishes and comfort. Situated on a spacious 10,019 SqFt lot, there's plenty of room for expansion, pool or an ADU. Great outdoor living, entertaining or family gatherings on a large patio. A must-see opportunity with endless possibilities!
Features & Amenities
Property Details
Mortgage Calculator
Current Rates
Comparative Market Analysis
Affordable Tier · 1 active · 5 closed
29 Palms · Single Family Residence
Listed in line with the median closed sale of $250,000. Price per sqft ($211) is a 16% discount to closed comps ($250).
Price Position
Aligned with the market — fair pricing for the comps.
Active Properties (1)
Active Comparables
| Address | City | Year | BD | BTH | SqFt | LotSz | LP/SqFt | LP | DIM | Score |
|---|---|---|---|---|---|---|---|---|---|---|
| 10213 Overland | Beaumont | 1975 | 2 | 2 | 1,440 | 4,356 | $187 | $268,885 | 86 | 69 |
| Total: 1 · Average | 2.0 | 2.0 | 1,440 | 4,356 | $187 | $268,885 | 86 | |||
| Median | 1,440 | $268,885 | ||||||||
Closed Properties (5)
Closed Comparables
| Address | City | Year | Date | BD | BTH | SqFt | LotSz | LP | SP | SP/SqFt | SP/LP | DIM | Score |
|---|---|---|---|---|---|---|---|---|---|---|---|---|---|
| 13255 Quinta | Desert Hot Springs | 1984 | 06/16/2026 | 2 | 2 | 1,120 | 7,405 | $199,999 | $240,000 | $214 | 1.20 | 43 | 78 |
| 10890 Bel Air Drive | Cherry Valley | 1986 | 05/28/2026 | 2 | 2 | 1,152 | 4,792 | $249,000 | $249,000 | $216 | 1.00 | 49 | 70 |
| 10811 Bel Air | Cherry Valley | 1986 | 01/29/2026 | 2 | 2 | 1,344 | 4,356 | $275,000 | $267,500 | $199 | 0.97 | 98 | 68 |
| 10497 Bel Air Drive | Cherry Valley | 1993 | 12/05/2025 | 2 | 2 | 1,029 | 4,356 | $289,900 | $284,900 | $277 | 0.98 | 44 | 66 |
| 40587 Dutton Street | Cherry Valley | 1925 | 08/03/2026 | 2 | 1 | 730 | 40,075 | $299,000 | $250,000 | $342 | 0.84 | 349 | 60 |
| Total: 5 · Average | 2.0 | 1.8 | 1,075 | 12,196.8 | $258,280 | $258,280 | $249.6 | — | 116.6 | ||||
| Median | 1,120 | $250,000 | $250,000 | ||||||||||
Market Analysis
List vs Sale $/SqFt
Sale Price Trend
Days on Market
Sale vs List Price
This analysis was generated automatically from MLS data. For an in-depth, human-reviewed valuation, contact Joseph Sardella at josephsardella@gmail.com.