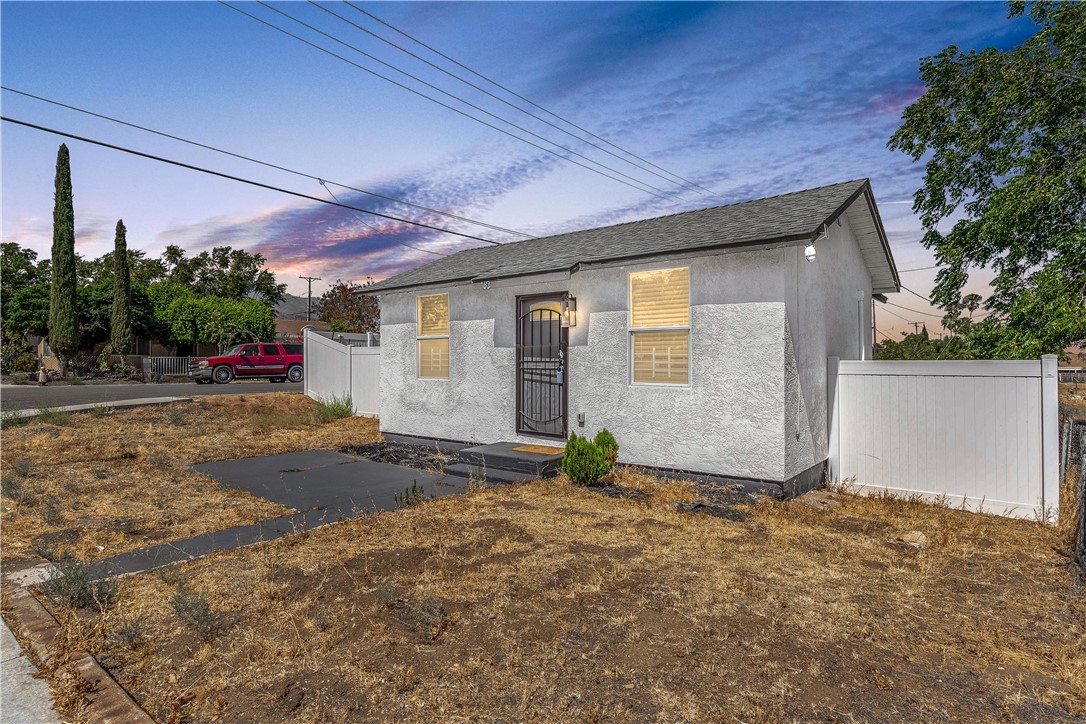
1 / 25
582 North Almond, Banning, CA 92220
$350K2bd · 1ba · 495 sqft
Lot 8,276 sqft•Single Family Residence•Active•109d on market•MLS# IV-26155706
582 North Almond, Banning, CA 92220
MLS# IV-26155706•Residential•Single Family Residence
Active109 days on market
$349,999
2
Beds
1
Baths
495
Sq Ft
8,276
Lot Sq Ft
1935
Year Built
None
View
Property Description
Cozy 2 bedroom 1 bath home in the heart of Banning just waiting for it's new owner. Perfect for first time homebuyers. Don't let the small size fool you, there is plenty of room to grow. Close to shopping and freeway.
Features & Amenities
FeeBuilt 1935
Property Details
Land Type
Fee
Year Built
1935
Property Type
Residential
Property Subtype
Single Family Residence
Parking Spaces
1
Garage Spaces
1
Heating
Central
Cooling
None
View
None
City
Banning
Zip Code
92220
County
Riverside
Mortgage Calculator
Current Rates
$
$
%
Monthly Payment
$1,769.78
Principal & Interest
Loan Amount
$279,999
Total Interest
$357,123
Total Payment Over 30 Years
$637,122
This calculator provides estimates only. Actual mortgage payments may include taxes, insurance, HOA fees, and PMI. Contact a lender for accurate quotes.
Comparative Market Analysis
Affordable Tier · 5 active · 5 closed
582 North Almond, Banning, CA 92220
Banning · Single Family Residence
$350K
Affordable TierBeds
2
Baths
1
Sqft
495
Lot
8,276 sqft
Year
1935
$/Sqft
$707
Pool: No✓
View: None✓
Garage: 1-car✓
Listed in line with the median closed sale of $350,000. Price per sqft ($707) is a 61% premium to closed comps ($438). Closed comps sold at 100% of list — strong seller's market.
Price Position
Aligned with the market — fair pricing for the comps.
At market
Subject listed at $350K· $707/sqft
Total list price
Closed comps
vs closed median $350K
−$1 (−0.0%)
Active comps
vs active median $349K
+$999 (+0.3%)
Price per sqft
Closed compsinsufficient comp data
Active comps
vs active avg $/sqft $431
+$276 (+63.9%)
Active Properties (5)
Active Comparables
| Address | City | Year | BD | BTH | SqFt | LotSz | LP/SqFt | LP | DIM | Score |
|---|---|---|---|---|---|---|---|---|---|---|
| 430 Martin Street | Banning | 1935 | 1 | 1 | 436 | 6,098 | $688 | $300,000 | 2 | 88 |
| 339 ALESSANDRO Street | Banning | 1946 | 2 | 1 | 894 | 5,227 | $414 | $369,900 | 58 | 71 |
| 481 Martin | Banning | 1934 | 2 | 2 | 932 | 6,098 | $322 | $299,900 | 33 | 69 |
| 581 Hoffer Street | Banning | 1953 | 2 | 1 | 959 | 9,583 | $364 | $349,000 | 9 | 67 |
| 1010 Nicolet Street | Banning | 1924 | 3 | 2 | 1,042 | 8,712 | $369 | $385,000 | 328 | 61 |
| Total: 5 · Average | 2.0 | 1.4 | 852.6 | 7,143.6 | $431.4 | $340,760 | 86 | |||
| Median | 932 | $349,000 | ||||||||
Closed Properties (5)
Closed Comparables
| Address | City | Year | Date | BD | BTH | SqFt | LotSz | LP | SP | SP/SqFt | SP/LP | DIM | Score |
|---|---|---|---|---|---|---|---|---|---|---|---|---|---|
| 1058 Hermosa | Banning | 1932 | 09/22/2026 | 2 | 1 | 500 | 9,148 | $338,950 | $339,000 | $678 | 1.00 | 81 | 95 |
| 685 Allen | Banning | 1947 | 06/03/2026 | 2 | 1 | 680 | 6,098 | $300,000 | $300,000 | $441 | 1.00 | 117 | 78 |
| 494 Drury | Banning | 1935 | 05/21/2026 | 2 | 2 | 977 | 6,534 | $379,000 | $390,000 | $399 | 1.03 | 21 | 66 |
| 376 Fay Street | Banning | 1940 | 09/10/2026 | 2 | 2 | 1,050 | 6,534 | $359,000 | $350,000 | $333 | 0.97 | 99 | 65 |
| 292 George Street | Banning | 1922 | 08/25/2026 | 3 | 1 | 1,170 | 11,326 | $395,000 | $395,000 | $338 | 1.00 | 54 | 62 |
| Total: 5 · Average | 2.2 | 1.4 | 875.4 | 7,928 | $354,800 | $354,800 | $437.8 | — | 74.4 | ||||
| Median | 977 | $350,000 | $350,000 | ||||||||||
Market Analysis
List vs Sale $/SqFt
Sale Price Trend
Days on Market
Sale vs List Price
AI-generated CMA
This analysis was generated automatically from MLS data. For an in-depth, human-reviewed valuation, contact Joseph Sardella at josephsardella@gmail.com.