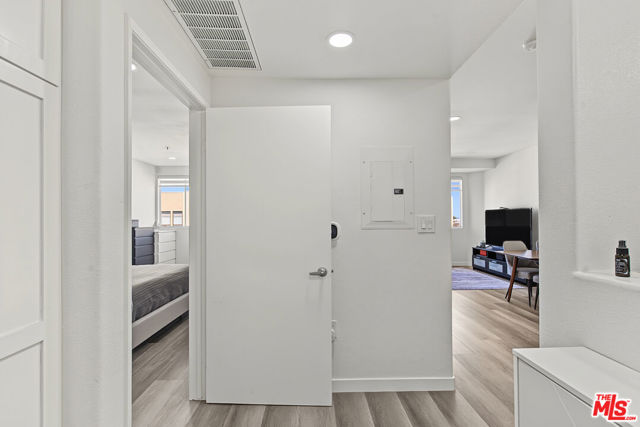
1 / 49
580 West Main Street, 329, Alhambra, CA 91801
$489K1bd · 2ba · 735 sqft
Lot 92,118 sqft•HOA $427/mo•Condominium•Active•5d on market•MLS# 00-26105195
580 West Main Street, 329, Alhambra, CA 91801
MLS# 00-26105195•Residential•Condominium
Active5 days on market
$489,000
1
Beds
2
Baths
735
Sq Ft
92,118
Lot Sq Ft
$427
HOA/mo
2004
Year Built
Property Description
Heart of Alhambra, well maintained 1bedroom,2 bathroom, very specious living and dining areas. Enjoy community tennis court and recreation area and security cameras throughout the common areas. Walking distance restaurant, shopping and convenient area.
Features & Amenities
FeeBuilt 2004
Property Details
Land Type
Fee
Year Built
2004
Property Type
Residential
Property Subtype
Condominium
Heating
Central
Cooling
Central Air
Flooring
Laminate
City
Alhambra
Zip Code
91801
County
Los Angeles
Mortgage Calculator
Current Rates
$
$
%
Monthly Payment
$2,472.65
Principal & Interest
Loan Amount
$391,200
Total Interest
$498,954
Total Payment Over 30 Years
$890,154
This calculator provides estimates only. Actual mortgage payments may include taxes, insurance, HOA fees, and PMI. Contact a lender for accurate quotes.
Comparative Market Analysis
Affordable Tier · 5 active · 5 closed
580 West Main Street, 329, Alhambra, CA 91801
Alhambra · Condominium
$489K
Affordable TierBeds
1
Baths
2
Sqft
735
Lot
2.11 ac
Year
2004
$/Sqft
$665
Pool: No✓
Listed in line with the median closed sale of $500,000. Closed comps sold at 101% of list — strong seller's market.
Price Position
Aligned with the market — fair pricing for the comps.
At market
Subject listed at $489K· $665/sqft
Total list price
Closed comps
vs closed median $500K
−$11K (−2.2%)
Active comps
vs active median $498K
−$9K (−1.8%)
Price per sqft
Closed compsinsufficient comp data
Active comps
vs active avg $/sqft $563
+$102 (+18.2%)
Active Properties (5)
Active Comparables
| Address | City | Year | BD | BTH | SqFt | LotSz | LP/SqFt | LP | DIM | Score |
|---|---|---|---|---|---|---|---|---|---|---|
| 11 3rd Street | Alhambra | 2015 | 1 | 2 | 760 | 49,840 | $734 | $558,000 | 11 | 91 |
| 315 Almansor Street | Alhambra | 1979 | 2 | 1 | 887 | 70,240 | $561 | $498,000 | 4 | 75 |
| 121 Mcpherrin Avenue | Monterey Park | 1999 | 2 | 2 | 949 | 19,463 | $525 | $498,000 | 30 | 67 |
| 236 De Anza Street | San Gabriel | 1962 | 2 | 1 | 900 | 117,223 | $478 | $430,000 | 37 | 63 |
| 228 De Anza | San Gabriel | 1962 | 2 | 1 | 931 | 117,223 | $516 | $480,000 | 170 | 59 |
| Total: 5 · Average | 1.8 | 1.4 | 885.4 | 74,797.8 | $562.8 | $492,800 | 50.4 | |||
| Median | 900 | $498,000 | ||||||||
Closed Properties (5)
Closed Comparables
| Address | City | Year | Date | BD | BTH | SqFt | LotSz | LP | SP | SP/SqFt | SP/LP | DIM | Score |
|---|---|---|---|---|---|---|---|---|---|---|---|---|---|
| 580 Main Street #322 | Alhambra | 2004 | 10/26/2026 | 2 | 2 | 737 | 92,118 | $459,000 | $465,000 | $631 | 1.01 | 27 | 94 |
| 580 Main Street | Alhambra | 2004 | 06/25/2026 | 2 | 2 | 737 | 92,118 | $499,000 | $525,000 | $712 | 1.05 | 162 | 91 |
| 580 Main | Alhambra | 2004 | 10/20/2026 | 2 | 1 | 737 | 92,118 | $500,000 | $500,000 | $678 | 1.00 | 54 | 90 |
| 111 2nd | Alhambra | 2009 | 05/27/2026 | 1 | 2 | 720 | 24,419 | $480,000 | $458,000 | $636 | 0.95 | 125 | 88 |
| 200 5th Street | Alhambra | 2003 | 08/20/2026 | 2 | 2 | 1,034 | 22,628 | $518,000 | $523,000 | $506 | 1.01 | 155 | 78 |
| Total: 5 · Average | 1.8 | 1.8 | 793 | 64,680.2 | $494,200 | $494,200 | $632.6 | — | 104.6 | ||||
| Median | 737 | $500,000 | $500,000 | ||||||||||
Market Analysis
List vs Sale $/SqFt
Sale Price Trend
Days on Market
Sale vs List Price
AI-generated CMA
This analysis was generated automatically from MLS data. For an in-depth, human-reviewed valuation, contact Joseph Sardella at josephsardella@gmail.com.