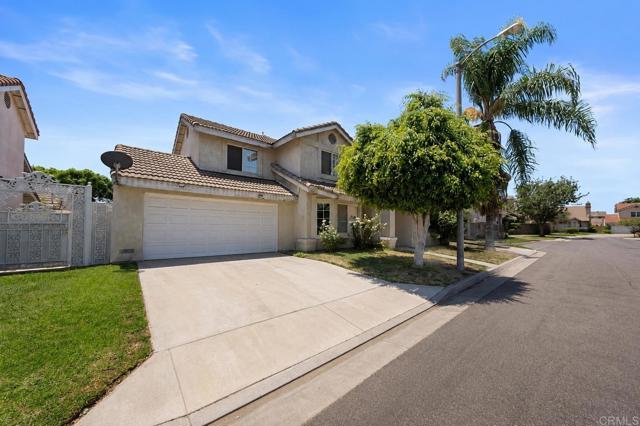
5542 Sun Lane, Bell Gardens, CA 90201
5542 Sun Lane, Bell Gardens, CA 90201
Property Description
Welcome to 5542 Sun Ln in Bell Gardens! This 4-bedroom, 2 and a half bath home offers a spacious floor plan with plenty of room to fit a variety of needs. Conveniently located near schools, parks, shopping, dining, and major freeways, you’ll enjoy easy access to everyday amenities. The property presents a great opportunity for buyers looking to update and personalize a home to their own style. With its generous layout and desirable location, this home is full of potential. Don’t miss the chance to make it your own!
Features & Amenities
Property Details
Mortgage Calculator
Current Rates
Comparative Market Analysis
Residential Tier · 5 active · 5 closed
Bell Gardens · Single Family Residence
Listed in line with the median closed sale of $710,000. Price per sqft ($400) is a 40% discount to closed comps ($667).
Price Position
Aligned with the market — fair pricing for the comps.
Active Properties (5)
Active Comparables
| Address | City | Year | BD | BTH | SqFt | LotSz | LP/SqFt | LP | DIM | Score |
|---|---|---|---|---|---|---|---|---|---|---|
| 4840 Brompton | Bell Gardens | 1941 | 3 | 2 | 1,291 | 5,701 | $581 | $749,999 | 9 | 71 |
| 6546 Foster Bridge | Bell Gardens | 1942 | 3 | 1 | 1,128 | 3,508 | $634 | $715,000 | 96 | 67 |
| 3601 Anita Drive | Bell | 1942 | 5 | 2 | 1,648 | 5,380 | $479 | $788,888 | 7 | 66 |
| 2458 Gaspar Avenue | Commerce | 1944 | 3 | 2 | 1,233 | 5,173 | $575 | $709,000 | 115 | 61 |
| 9517 San Miguel Avenue | South Gate | 1923 | 4 | 2 | 1,379 | 4,839 | $489 | $675,000 | 1 | 61 |
| Total: 5 · Average | 3.6 | 1.8 | 1,335.8 | 4,920.2 | $551.6 | $727,577.4 | 45.6 | |||
| Median | 1,291 | $715,000 | ||||||||
Closed Properties (5)
Closed Comparables
| Address | City | Year | Date | BD | BTH | SqFt | LotSz | LP | SP | SP/SqFt | SP/LP | DIM | Score |
|---|---|---|---|---|---|---|---|---|---|---|---|---|---|
| 7601 Wilcox Avenue | Cudahy | 1940 | 04/07/2026 | 5 | 3 | 2,240 | 3,747 | $779,000 | $789,000 | $352 | 1.01 | 50 | 74 |
| 4906 59th Place | Maywood | 1923 | 09/03/2026 | 3 | 2 | 1,456 | 6,976 | $745,000 | $745,000 | $512 | 1.00 | 52 | 67 |
| 5952 Priory | Bell Gardens | 1947 | 10/14/2026 | 3 | 1 | 1,052 | 5,150 | $719,998 | $710,000 | $675 | 0.99 | 86 | 66 |
| 6833 Crafton Avenue | Bell | 1943 | 06/30/2026 | 2 | 1 | 836 | 2,671 | $680,000 | $660,000 | $789 | 0.97 | 96 | 65 |
| 5617 Loveland Street | Bell Gardens | 1947 | 09/24/2026 | 2 | 1 | 704 | 4,131 | $689,999 | $710,000 | $1,009 | 1.03 | 34 | 64 |
| Total: 5 · Average | 3.0 | 1.6 | 1,257.6 | 4,535 | $722,800 | $722,800 | $667.4 | — | 63.6 | ||||
| Median | 1,052 | $710,000 | $710,000 | ||||||||||
Market Analysis
List vs Sale $/SqFt
Sale Price Trend
Days on Market
Sale vs List Price
This analysis was generated automatically from MLS data. For an in-depth, human-reviewed valuation, contact Joseph Sardella at josephsardella@gmail.com.