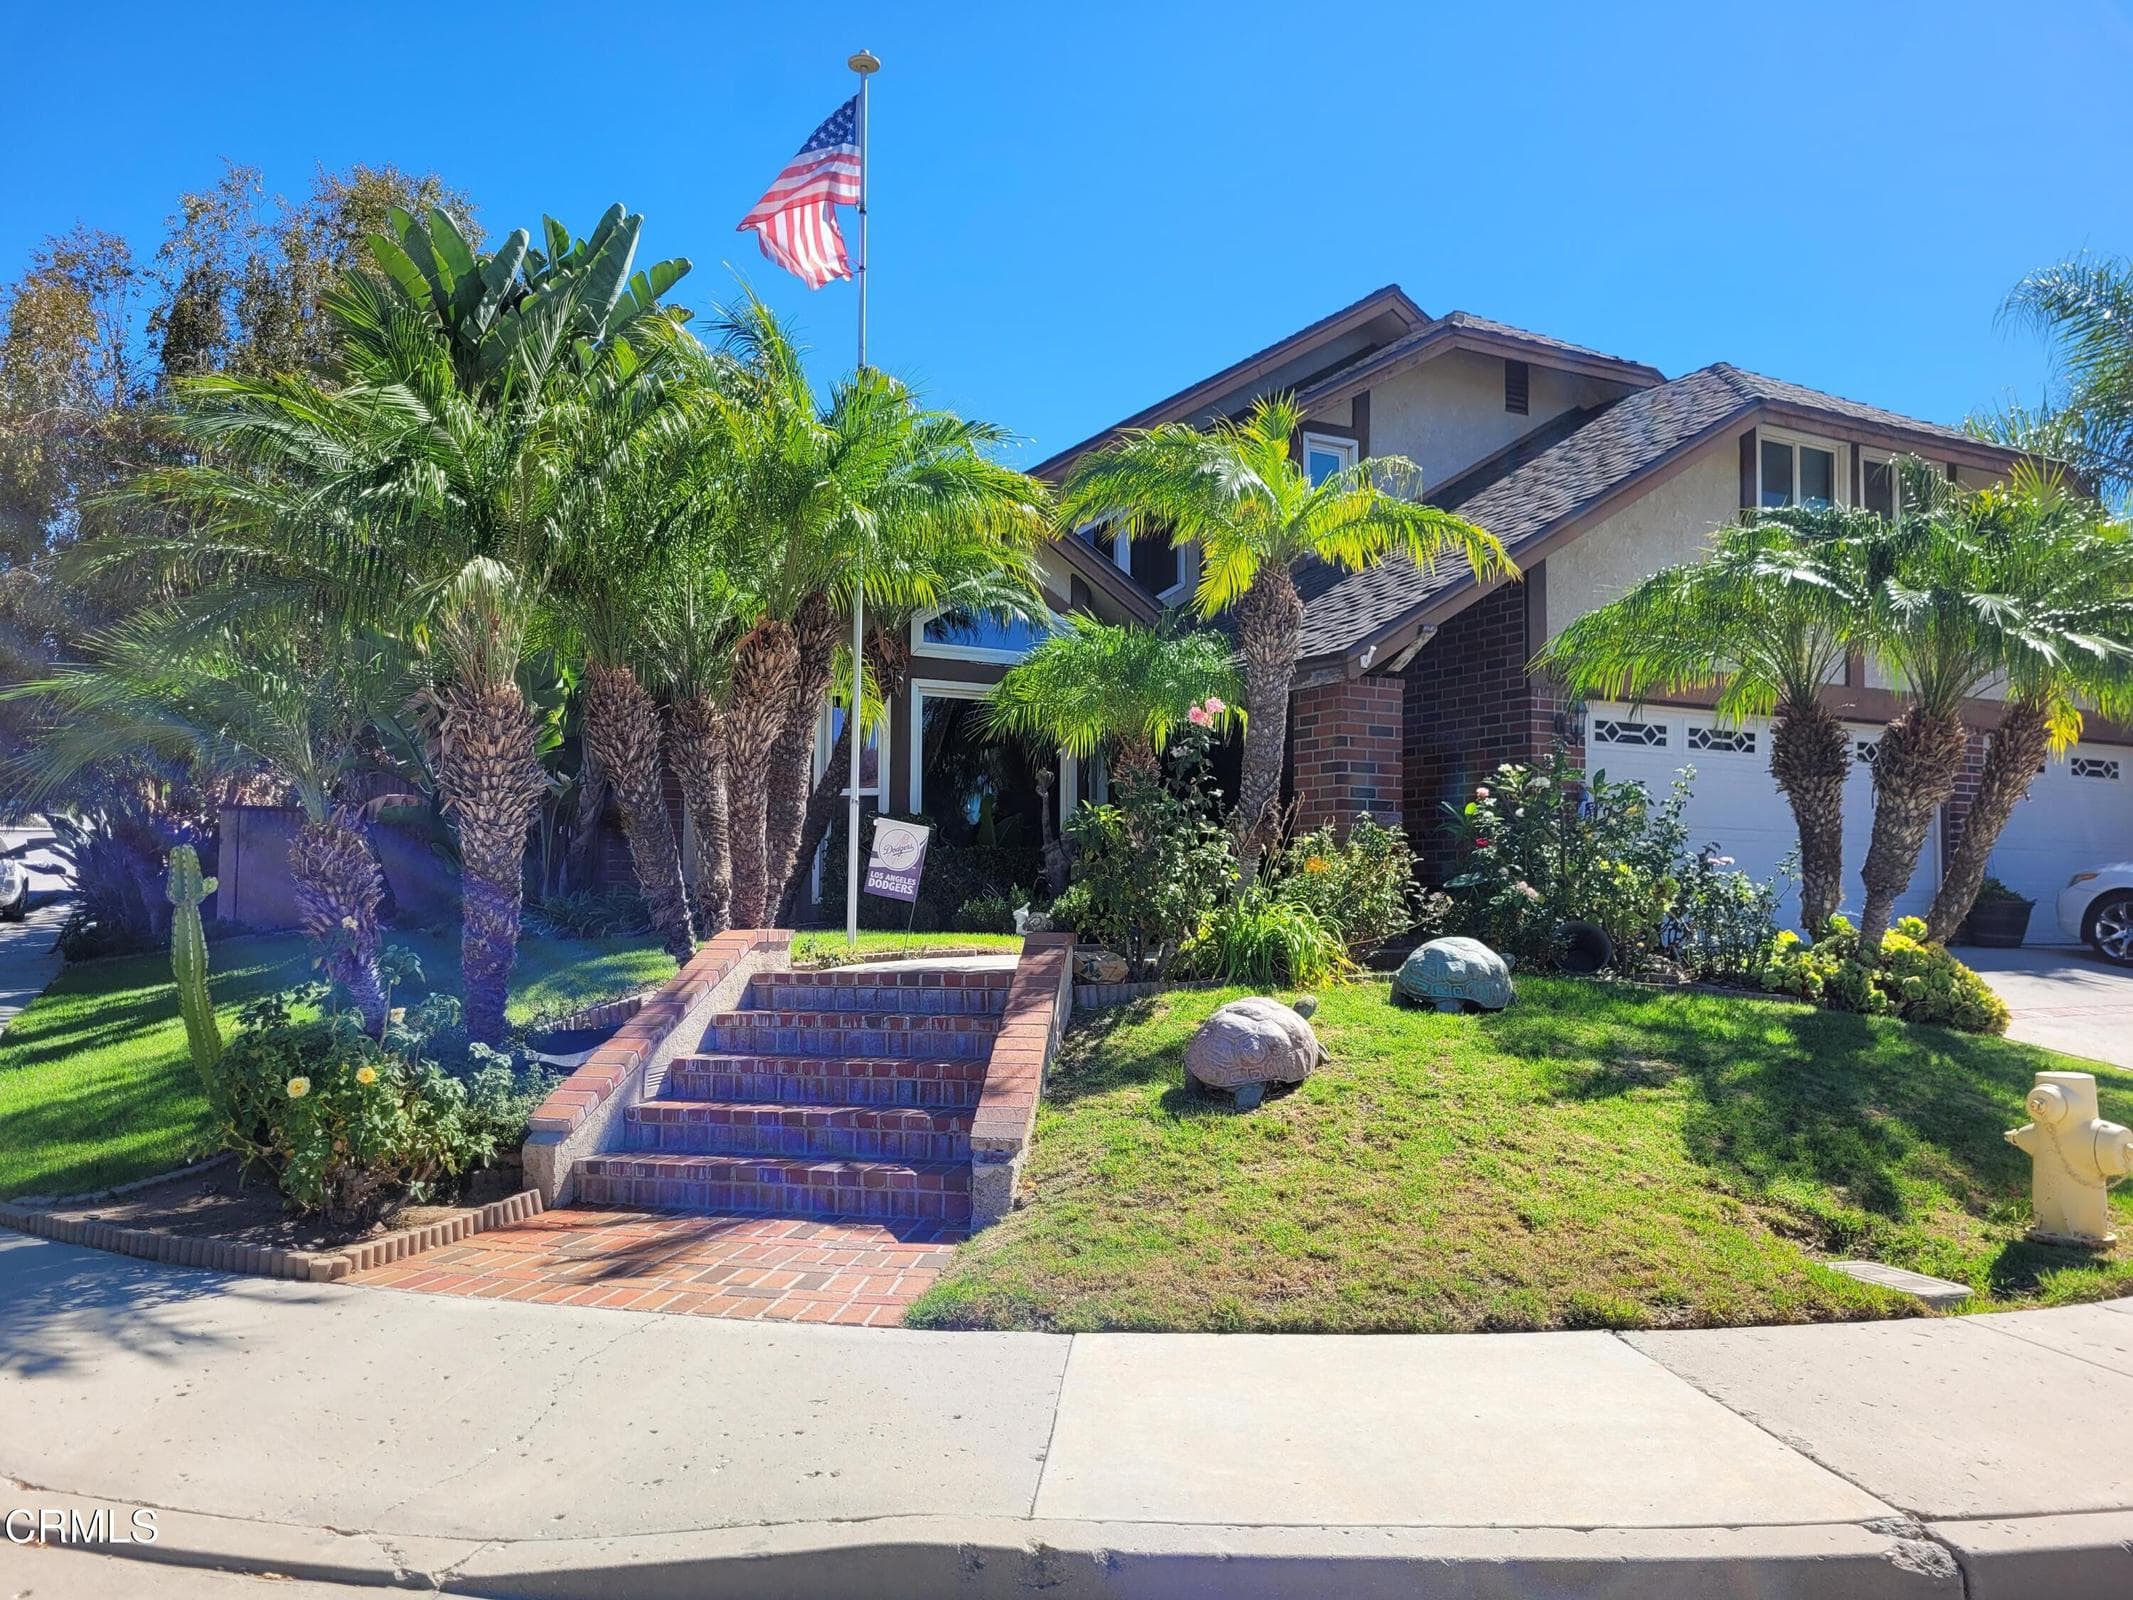
551 Stonehedge Drive, Fillmore, CA 93015
551 Stonehedge Drive, Fillmore, CA 93015
Property Description
Welcome to this inviting 4-bedroom, 3.5-bathroom home offering the perfect blend of comfort and outdoor enjoyment! Featuring a private pool and Jacuzzi, this property is ideal for relaxing, entertaining, and enjoying the California lifestyle. With four bedrooms and three-and-a-half bathrooms, there is plenty of space to accommodate a variety of living needs. Whether you're hosting summer gatherings, enjoying a refreshing swim, or unwinding in the Jacuzzi at the end of the day, this home offers wonderful opportunities to make lasting memories. Don't miss the opportunity to make this Fillmore property your own!
Features & Amenities
Property Details
Mortgage Calculator
Current Rates
About Woodgrove 2 - 256602
This property is located in Woodgrove 2 - 256602, a community in Fillmore. Explore more listings in this neighborhood to compare options and pricing.
View Woodgrove 2 - 256602 ListingsComparative Market Analysis
Residential Tier · 5 active · 5 closed
Woodgrove 2 - 256602 · Fillmore · Single Family Residence
Listed 11.3% above the median closed sale of $790,000. Price per sqft ($307) is a 16% discount to closed comps ($366). Closed comps sold at 100% of list — strong seller's market.
Price Position
Positioned above the market — commands a premium.
Active Properties (5)
Active Comparables
| Address | City | Year | BD | BTH | SqFt | LotSz | LP/SqFt | LP | DIM | Score |
|---|---|---|---|---|---|---|---|---|---|---|
| 639 Chapparel Street | Fillmore | 1977 | 4 | 3 | 2,068 | 7,380 | $394 | $815,000 | 14 | 65 |
| 1034 Candelaria Lane | Fillmore | 2003 | 3 | 3 | 2,258 | 5,995 | $389 | $879,000 | 3 | 65 |
| 379 Foothill Drive | Fillmore | 1965 | 4 | 3 | 2,444 | 10,890 | $368 | $899,000 | 138 | 60 |
| 222 2nd | Fillmore | 1967 | 3 | 2 | 1,768 | 7,838 | $441 | $780,000 | 25 | 58 |
| 385 Azalea Street | Fillmore | 2021 | 4 | 5 | 3,177 | 6,204 | $266 | $844,000 | 23 | 55 |
| Total: 5 · Average | 3.6 | 3.2 | 2,343 | 7,661.4 | $371.6 | $843,400 | 40.6 | |||
| Median | 2,258 | $844,000 | ||||||||
Closed Properties (5)
Closed Comparables
| Address | City | Year | Date | BD | BTH | SqFt | LotSz | LP | SP | SP/SqFt | SP/LP | DIM | Score |
|---|---|---|---|---|---|---|---|---|---|---|---|---|---|
| 1112 Mockingbird Lane | Fillmore | 1990 | 05/19/2026 | 4 | 3 | 2,064 | 8,189 | $799,900 | $800,000 | $388 | 1.00 | 50 | 61 |
| 555 Kensington Drive | Fillmore | 1925 | 01/13/2026 | 4 | 3 | 2,699 | 13,068 | $859,999 | $855,900 | $317 | 0.99 | 26 | 60 |
| 947 Meadowlark Drive | Fillmore | 1992 | 04/27/2026 | 5 | 3 | 2,010 | 5,096 | $745,000 | $770,000 | $383 | 1.03 | 32 | 56 |
| 1120 1st Street | Fillmore | 1991 | 05/08/2026 | 4 | 3 | 2,165 | 6,054 | $799,500 | $790,000 | $365 | 0.99 | 48 | 55 |
| 984 Meadowlark Drive | Fillmore | 1993 | 08/28/2026 | 3 | 3 | 2,071 | 6,148 | $785,000 | $785,000 | $379 | 1.00 | 9 | 54 |
| Total: 5 · Average | 4.0 | 3.0 | 2,201.8 | 7,711 | $800,180 | $800,180 | $366.4 | — | 33 | ||||
| Median | 2,071 | $790,000 | $790,000 | ||||||||||
Market Analysis
List vs Sale $/SqFt
Sale Price Trend
Days on Market
Sale vs List Price
This analysis was generated automatically from MLS data. For an in-depth, human-reviewed valuation, contact Joseph Sardella at josephsardella@gmail.com.