5484 Seacliff Place, 47, San Diego, CA 92154
5484 Seacliff Place, 47, San Diego, CA 92154
Property Description
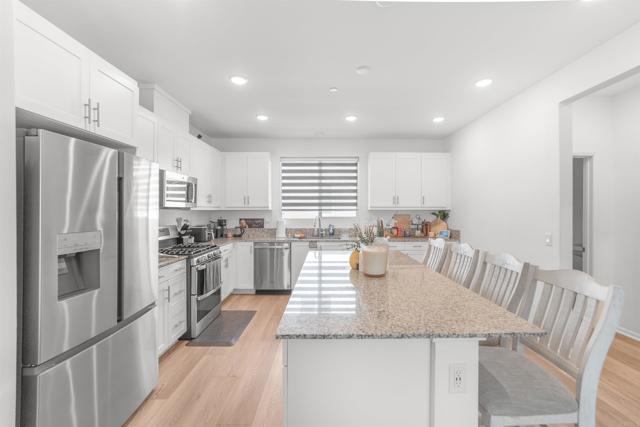
5.249% VA ASSUMABLE LOA LOAN SELLER WILL ENTERTAIN OFFERS BETWEEN $710,000 - $715,000. Welcome to this beautifully maintained 2022-built townhome in desirable La Brisa. This spacious 3-story home features 4 bedrooms, 3.5 baths, and approximately 1,785 sq. ft. of modern living space. Enjoy an open-concept floor plan with high ceilings, abundant natural light, and luxury vinyl flooring throughout—completely carpet-free. The contemporary kitchen features granite countertops, stainless steel appliances, ample cabinetry, and includes the refrigerator. Spacious primary suite with walk-in closet and en-suite bath. Additional highlights include Smart Home technology, private balcony, tankless water heater, attached 2-car garage, and owned solar panels with no third-party lease. Washer and dryer included. HOA is $250/month and covers roof, exterior doors, stucco, common areas, and two community dog parks. No Mello-Roos or special assessments. Conveniently located near shopping, dining, entertainment, major freeways, and exciting new shopping centers under construction. Fantastic neighborhood with a welcoming community feel!
Features & Amenities
Property Details
Mortgage Calculator
Current Rates
Comparative Market Analysis
Residential Tier · 5 active · 5 closed
San Diego · Townhouse
Listed 7.7% above the median closed sale of $650,000.
Price Position
Positioned above the market — commands a premium.
Active Properties (5)
Active Comparables
| Address | City | Year | BD | BTH | SqFt | LotSz | LP/SqFt | LP | DIM | Score |
|---|---|---|---|---|---|---|---|---|---|---|
| 5470 Shorefront Drive | San Diego | 2022 | 4 | 4 | 1,785 | 0 | $353 | $629,900 | 13 | 100 |
| 5480 Seacliff Place | San Diego | 2022 | 4 | 4 | 1,946 | 0 | $349 | $679,900 | 32 | 97 |
| 5280 Beachfront Cove | San Diego | 2021 | 4 | 3 | 1,696 | 0 | $353 | $599,000 | 31 | 91 |
| 5208 Surfwalk Way | San Diego | 2021 | 4 | 3 | 1,696 | 0 | $371 | $629,000 | 59 | 90 |
| 5360 Calle Rockfish | San Diego | 2019 | 3 | 3 | 1,595 | 0 | $414 | $660,000 | 2 | 86 |
| Total: 5 · Average | 3.8 | 3.4 | 1,743.6 | 0 | $368 | $639,560 | 27.4 | |||
| Median | 1,696 | $629,900 | ||||||||
Closed Properties (5)
Closed Comparables
| Address | City | Year | Date | BD | BTH | SqFt | LotSz | LP | SP | SP/SqFt | SP/LP | DIM | Score |
|---|---|---|---|---|---|---|---|---|---|---|---|---|---|
| 5464 Shorefront Drive | San Diego | 2023 | 05/21/2026 | 4 | 4 | 1,946 | 0 | $690,000 | $695,000 | $357 | 1.01 | 65 | 95 |
| 1606 San Sebastian | San Diego | 2021 | 08/21/2026 | 3 | 3 | 1,600 | 0 | $635,000 | $650,000 | $406 | 1.02 | 21 | 89 |
| 5501 San Rafael | San Diego | 2021 | 07/28/2026 | 3 | 3 | 1,600 | 0 | $650,000 | $630,000 | $394 | 0.97 | 129 | 89 |
| 5480 Seacliff Pl | San Diego | 2022 | 02/11/2026 | 3 | 3 | 1,703 | 0 | $670,000 | $660,000 | $388 | 0.98 | 37 | 89 |
| 5479 San Alejandro | San Diego | 2020 | 04/24/2026 | 3 | 3 | 1,600 | 0 | $650,000 | $650,000 | $406 | 1.00 | 23 | 87 |
| Total: 5 · Average | 3.2 | 3.2 | 1,689.8 | 0 | $657,000 | $657,000 | $390.2 | — | 55 | ||||
| Median | 1,600 | $650,000 | $650,000 | ||||||||||
Market Analysis
List vs Sale $/SqFt
Sale Price Trend
Days on Market
Sale vs List Price
This analysis was generated automatically from MLS data. For an in-depth, human-reviewed valuation, contact Joseph Sardella at josephsardella@gmail.com.