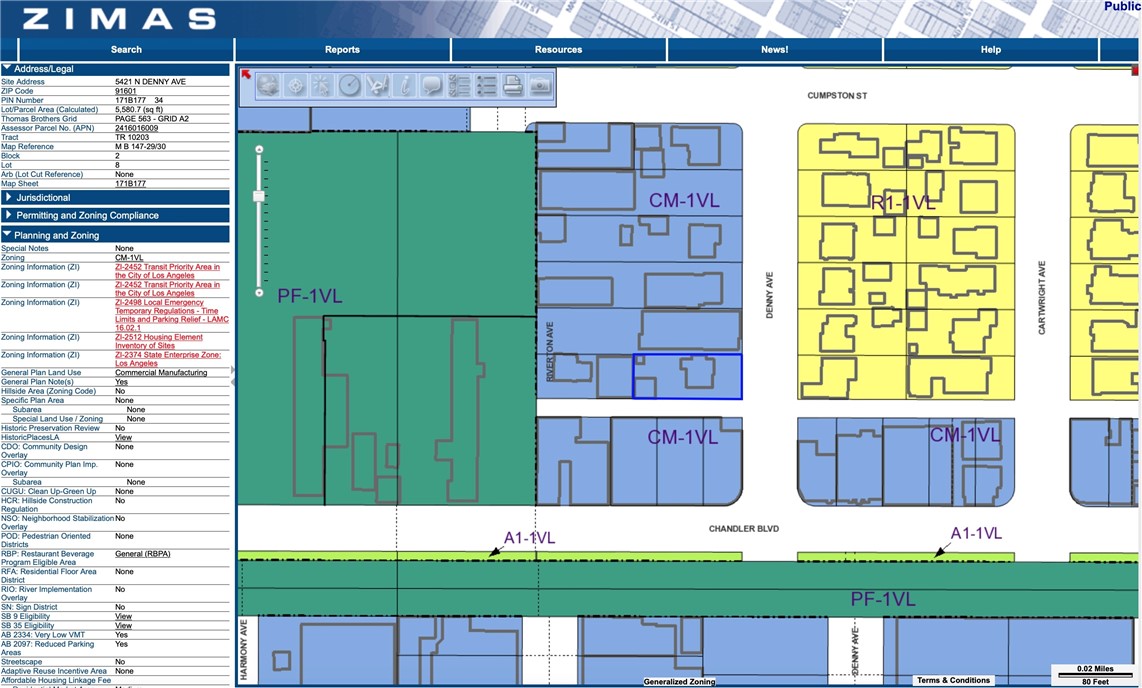
5421 Denny Avenue, North Hollywood, CA 91601
5421 Denny Avenue, North Hollywood, CA 91601
Property Description
DEVELOPMENT OPPORTUNITY (TOC Tier 1) Eligible for 100% Affordable ED1 Projects. Existing Single Family home located on a CM-1VL zoned lot with 117 feet of alley access. CM Zone allows for R3 Residential Density and Mixed use development. Buyer to verify potential uses and allowable development opportunities. Potential for 8 units, plus 2 Detached ADU's + 1-4 Attached ADU's. (Opportunity Zone) (State Enterprise Zone) Newer 2016 8 unit apartment building next-door. Located within less than half a mile from the Red Line North Hollywood Station and half a block from the Chandler Blvd Bike Path. Walking distance to the NoHo Arts District. See private Remarks on status of the House.
Features & Amenities
Property Details
Mortgage Calculator
Current Rates
Comparative Market Analysis
Affordable Tier · 5 active · 5 closed
North Hollywood · Single Family Residence
Listed 15.4% above the median closed sale of $1,040,000. Price per sqft ($1,546) is a 117% premium to closed comps ($711).
Price Position
Positioned above the market — commands a premium.
Active Properties (5)
Active Comparables
| Address | City | Year | BD | BTH | SqFt | LotSz | LP/SqFt | LP | DIM | Score |
|---|---|---|---|---|---|---|---|---|---|---|
| 5221 Satsuma | North Hollywood | 1922 | 2 | 1 | 840 | 5,401 | $1,310 | $1.10M | 348 | 83 |
| 5058 Cartwright | North Hollywood | 1947 | 2 | 1 | 1,368 | 6,109 | $804 | $1.10M | 10 | 73 |
| 5546 Strohm | North Hollywood | 1937 | 3 | 2 | 1,690 | 6,327 | $740 | $1.25M | 53 | 59 |
| 10414 Tiara Street | North Hollywood | 1948 | 3 | 3 | 1,478 | 6,003 | $880 | $1.30M | 81 | 58 |
| 1130 Maple Street | Burbank | 1939 | 3 | 3 | 1,746 | 6,752 | $715 | $1.25M | 96 | 51 |
| Total: 5 · Average | 2.6 | 2.0 | 1,424.4 | 6,118.4 | $889.8 | $1.20M | 117.6 | |||
| Median | 1,478 | $1.25M | ||||||||
Closed Properties (5)
Closed Comparables
| Address | City | Year | Date | BD | BTH | SqFt | LotSz | LP | SP | SP/SqFt | SP/LP | DIM | Score |
|---|---|---|---|---|---|---|---|---|---|---|---|---|---|
| 10415 Cumpston | North Hollywood | 1944 | 06/12/2026 | 3 | 2 | 1,206 | 5,432 | $998,000 | $1.03M | $854 | 1.03 | 71 | 71 |
| 5055 Willowcrest | North Hollywood | 1950 | 10/23/2026 | 3 | 2 | 1,877 | 6,261 | $1.05M | $1.02M | $546 | 0.98 | 127 | 65 |
| 5513 Cartwright Avenue | North Hollywood | 1938 | 08/14/2026 | 3 | 2 | 1,551 | 5,852 | $1.05M | $1.04M | $671 | 0.99 | 46 | 62 |
| 5650 Denny Avenue | North Hollywood | 1944 | 07/09/2026 | 3 | 3 | 1,750 | 6,599 | $1.20M | $1.15M | $657 | 0.96 | 37 | 57 |
| 10404 Margate Street | North Hollywood | 1946 | 02/06/2026 | 3 | 2 | 1,512 | 6,490 | $1.20M | $1.25M | $827 | 1.04 | 58 | 56 |
| Total: 5 · Average | 3.0 | 2.2 | 1,579.2 | 6,126.8 | $1.10M | $1.10M | $711 | — | 67.8 | ||||
| Median | 1,551 | $1.04M | $1.04M | ||||||||||
Market Analysis
List vs Sale $/SqFt
Sale Price Trend
Days on Market
Sale vs List Price
This analysis was generated automatically from MLS data. For an in-depth, human-reviewed valuation, contact Joseph Sardella at josephsardella@gmail.com.