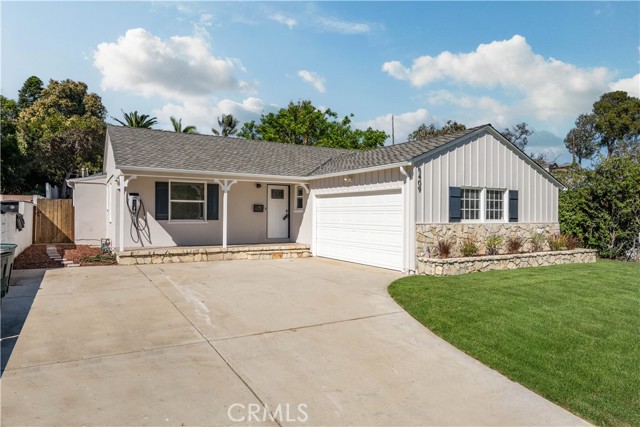
5409 Calle Mayor, Torrance, CA 90505
5409 Calle Mayor, Torrance, CA 90505
Property Description
Fabulous 5 bedroom, 3 bath family compound on incredible all usable approx. 9,658 lot. Check with city for guest house, ADU, and/or pool possibilities. The bathrooms and kitchen all have been updated with a open floorpan . formal living room, dinning room and family room with gas fireplace. This wonderful home has a new Presidential 3 dimensional comp roof, new rain gutters, fresh interior & exterior paint, electric car charger and great curb appeal with city light view.
Features & Amenities
Property Details
Mortgage Calculator
Current Rates
Comparative Market Analysis
Luxury Tier · 5 active · 5 closed
Torrance · Single Family Residence
Listed in line with the median closed sale of $2,050,000. Closed comps sold at 101% of list — strong seller's market. Luxury tier — fewer comparable sales widen the confidence range.
Price Position
Aligned with the market — fair pricing for the comps.
Active Properties (5)
Active Comparables
| Address | City | Year | BD | BTH | SqFt | LotSz | LP/SqFt | LP | DIM | Score |
|---|---|---|---|---|---|---|---|---|---|---|
| 5102 Calle De Arboles | Torrance | 1956 | 4 | 2 | 1,604 | 9,501 | $1,122 | $1.80M | 6 | 83 |
| 444 Via El Chico | Redondo Beach | 1973 | 3 | 3 | 2,397 | 7,406 | $876 | $2.10M | 68 | 81 |
| 1050 Avenue D | Redondo Beach | 1950 | 3 | 3 | 2,479 | 9,506 | $766 | $1.90M | 3 | 80 |
| 4413 Paseo De Las Tortugas | Torrance | 1956 | 3 | 2 | 1,468 | 21,632 | $1,185 | $1.74M | 74 | 70 |
| 336 Calle De Andalucia | Redondo Beach | 1948 | 3 | 2 | 1,600 | 7,101 | $1,416 | $2.27M | 5 | 68 |
| Total: 5 · Average | 3.2 | 2.4 | 1,909.6 | 11,029.2 | $1,073 | $1.96M | 31.2 | |||
| Median | 1,604 | $1.90M | ||||||||
Closed Properties (5)
Closed Comparables
| Address | City | Year | Date | BD | BTH | SqFt | LotSz | LP | SP | SP/SqFt | SP/LP | DIM | Score |
|---|---|---|---|---|---|---|---|---|---|---|---|---|---|
| 23508 Susana Avenue | Torrance | 1954 | 09/21/2026 | 3 | 2 | 1,722 | 5,601 | $1.93M | $2.05M | $1,190 | 1.06 | 61 | 81 |
| 444 Via El Chico | Redondo Beach | 1973 | 06/25/2026 | 3 | 3 | 2,397 | 7,406 | $2.20M | $2.12M | $884 | 0.96 | 56 | 81 |
| 5225 Zakon Road | Torrance | 1949 | 06/10/2026 | 3 | 2 | 1,738 | 6,396 | $1.85M | $1.89M | $1,089 | 1.02 | 35 | 80 |
| 4905 Paseo De Las Tortugas | Torrance | 1956 | 06/03/2026 | 3 | 2 | 1,468 | 12,453 | $1.88M | $1.82M | $1,243 | 0.97 | 68 | 77 |
| 5010 Paseo Del Pavon | Torrance | 1956 | 09/15/2026 | 4 | 3 | 2,291 | 10,338 | $2.10M | $2.13M | $928 | 1.01 | 41 | 75 |
| Total: 5 · Average | 3.2 | 2.4 | 1,923.2 | 8,438.8 | $2.00M | $2.00M | $1,066.8 | — | 52.2 | ||||
| Median | 1,738 | $2.05M | $2.05M | ||||||||||
Market Analysis
List vs Sale $/SqFt
Sale Price Trend
Days on Market
Sale vs List Price
This analysis was generated automatically from MLS data. For an in-depth, human-reviewed valuation, contact Joseph Sardella at josephsardella@gmail.com.