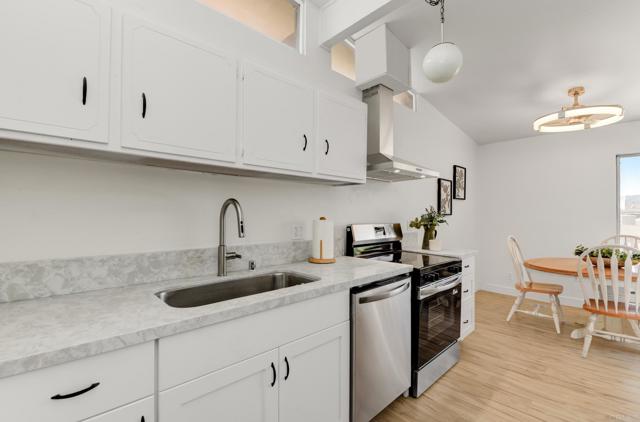
540 Oakdale Lane, L, El Cajon, CA 92021
540 Oakdale Lane, L, El Cajon, CA 92021
Property Description
Welcome to this charming 1-bedroom, 1-bathroom second-story condo offering a comfortable and inviting living space. The thoughtfully designed floor plan, with an upstairs location that provides a peaceful setting and plenty of natural light. As an end unit, the home also offers an added sense of privacy. Whether you’re a first-time buyer, looking to downsize, or searching for an investment opportunity, this is a wonderful place to call home. Conveniently located near shopping, dining, parks, and everyday amenities, this is an opportunity you won’t want to miss!
Features & Amenities
Property Details
Mortgage Calculator
Current Rates
Comparative Market Analysis
Affordable Tier · 5 active · 5 closed
El Cajon · Condominium
Listed 10.2% below the median closed sale of $305,000. Price per sqft ($389) is a 23% discount to closed comps ($503). Closed comps sold at 102% of list — strong seller's market.
Price Position
Priced below the market — value advantage over the field.
Active Properties (5)
Active Comparables
| Address | City | Year | BD | BTH | SqFt | LotSz | LP/SqFt | LP | DIM | Score |
|---|---|---|---|---|---|---|---|---|---|---|
| 1045 Peach Avenue | El Cajon | 1985 | 1 | 1 | 721 | 106,286 | $415 | $299,000 | 109 | 85 |
| 467 Ballantyne St | El Cajon | 1987 | 1 | 1 | 710 | 0 | $413 | $293,000 | 153 | 82 |
| 930 Peach Avenue | El Cajon | 1990 | 1 | 1 | 625 | 37,724 | $496 | $310,000 | 10 | 81 |
| 800 Mollison | El Cajon | 1995 | 1 | 1 | 460 | 0 | $598 | $275,000 | 100 | 74 |
| 800 Mollison Avenue | El Cajon | 1995 | 1 | 1 | 460 | 0 | $641 | $295,000 | 177 | 68 |
| Total: 5 · Average | 1.0 | 1.0 | 595.2 | 72,005 | $512.6 | $294,400 | 109.8 | |||
| Median | 625 | $295,000 | ||||||||
Closed Properties (5)
Closed Comparables
| Address | City | Year | Date | BD | BTH | SqFt | LotSz | LP | SP | SP/SqFt | SP/LP | DIM | Score |
|---|---|---|---|---|---|---|---|---|---|---|---|---|---|
| 540 Oakdale Lane | El Cajon | 1965 | 08/03/2026 | 1 | 1 | 704 | 0 | $299,000 | $305,000 | $433 | 1.02 | 87 | 98 |
| 930 Peach Avenue | El Cajon | 1990 | 09/23/2026 | 1 | 1 | 625 | 0 | $275,000 | $285,000 | $456 | 1.04 | 186 | 83 |
| 800 Mollison Avenue | El Cajon | 1995 | 10/28/2026 | 1 | 1 | 460 | 0 | $299,000 | $299,000 | $650 | 1.00 | 70 | 76 |
| 1386 Madison Avenue | El Cajon | 1990 | 11/14/2025 | 2 | 2 | 814 | 0 | $300,000 | $313,000 | $385 | 1.04 | 126 | 74 |
| 1160 Lexington Avenue | El Cajon | 1995 | 04/01/2026 | 1 | 1 | 518 | 20,038 | $309,000 | $305,000 | $589 | 0.99 | 47 | 73 |
| Total: 5 · Average | 1.2 | 1.2 | 624.2 | 20,038 | $301,400 | $301,400 | $502.6 | — | 103.2 | ||||
| Median | 625 | $305,000 | $305,000 | ||||||||||
Market Analysis
List vs Sale $/SqFt
Sale Price Trend
Days on Market
Sale vs List Price
This analysis was generated automatically from MLS data. For an in-depth, human-reviewed valuation, contact Joseph Sardella at josephsardella@gmail.com.