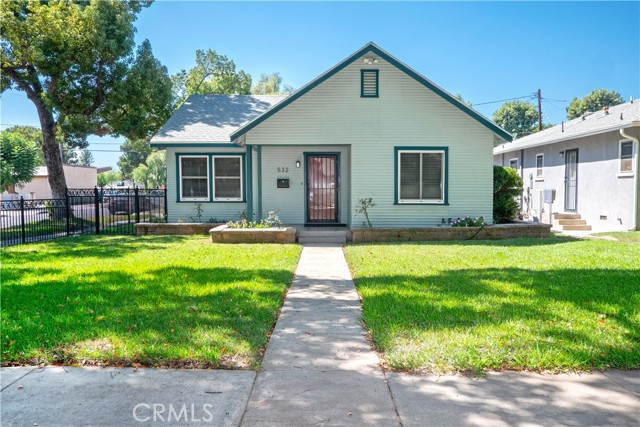
532 South Lemon, Ontario, CA 91761
532 South Lemon, Ontario, CA 91761
Property Description
TWO HOMES ON ONE LOT! Welcome to 532 S Lemon Avenue, featuring a beautifully updated main residence and a separate permitted home behind it. The main residence is a charming single-story home featuring two bedrooms and two bathrooms and has been beautifully remodeled throughout. Highlights include a brand-new kitchen, updated bathrooms, new flooring, air conditioning, and fresh finishes that make the home move-in ready. Behind the main residence is a permitted separate home featuring one bedroom, a living room, and a kitchen. This additional space offers excellent flexibility for a variety of uses, including guest accommodations, extended living space, a home office, or other permitted uses. Situated on a spacious property in the heart of Ontario, this unique property combines a beautifully renovated main residence with the added benefit of a permitted second living space. Conveniently located near shopping, dining, services, and major commuter routes, 532 S Lemon Avenue offers comfort, versatility, and outstanding potential.
Features & Amenities
Property Details
Mortgage Calculator
Current Rates
Comparative Market Analysis
Affordable Tier · 5 active · 5 closed
Ontario · Single Family Residence
Listed 10.9% above the median closed sale of $690,000. Price per sqft ($712) is a 22% premium to closed comps ($582).
Price Position
Positioned above the market — commands a premium.
Active Properties (5)
Active Comparables
| Address | City | Year | BD | BTH | SqFt | LotSz | LP/SqFt | LP | DIM | Score |
|---|---|---|---|---|---|---|---|---|---|---|
| 122 Park | Ontario | 1936 | 4 | 3 | 1,520 | 6,324 | $453 | $688,000 | 188 | 81 |
| 556 E. El Morado Court | Ontario | 1952 | 2 | 2 | 1,375 | 7,049 | $527 | $724,999 | 61 | 77 |
| 544 G | Ontario | 1952 | 4 | 2 | 1,460 | 8,040 | $503 | $735,000 | 10 | 69 |
| 1559 Pleasant | Ontario | 1952 | 5 | 3 | 1,777 | 6,030 | $439 | $780,000 | 80 | 68 |
| 1239 Vine Avenue | Ontario | 1960 | 3 | 2 | 2,025 | 13,000 | $346 | $700,000 | 31 | 63 |
| Total: 5 · Average | 3.6 | 2.4 | 1,631.4 | 8,088.6 | $453.6 | $725,599.8 | 74 | |||
| Median | 1,520 | $724,999 | ||||||||
Closed Properties (5)
Closed Comparables
| Address | City | Year | Date | BD | BTH | SqFt | LotSz | LP | SP | SP/SqFt | SP/LP | DIM | Score |
|---|---|---|---|---|---|---|---|---|---|---|---|---|---|
| 537 F Street | Ontario | 1952 | 08/28/2026 | 3 | 2 | 1,212 | 8,494 | $698,000 | $680,000 | $561 | 0.97 | 51 | 83 |
| 526 G | Ontario | 1946 | 12/11/2025 | 3 | 1 | 1,060 | 10,508 | $699,000 | $730,000 | $689 | 1.04 | 55 | 77 |
| 1311 Bonita Place | Ontario | 1981 | 09/09/2026 | 3 | 2 | 1,387 | 7,344 | $699,900 | $678,000 | $489 | 0.97 | 76 | 76 |
| 739 E Street | Ontario | 1952 | 08/24/2026 | 4 | 2 | 1,541 | 8,094 | $675,000 | $690,000 | $448 | 1.02 | 24 | 73 |
| 141 Cypress Avenue | Ontario | 1905 | 01/23/2026 | 3 | 2 | 1,121 | 22,900 | $855,000 | $810,000 | $723 | 0.95 | 226 | 69 |
| Total: 5 · Average | 3.2 | 1.8 | 1,264.2 | 11,468 | $717,600 | $717,600 | $582 | — | 86.4 | ||||
| Median | 1,212 | $690,000 | $690,000 | ||||||||||
Market Analysis
List vs Sale $/SqFt
Sale Price Trend
Days on Market
Sale vs List Price
This analysis was generated automatically from MLS data. For an in-depth, human-reviewed valuation, contact Joseph Sardella at josephsardella@gmail.com.