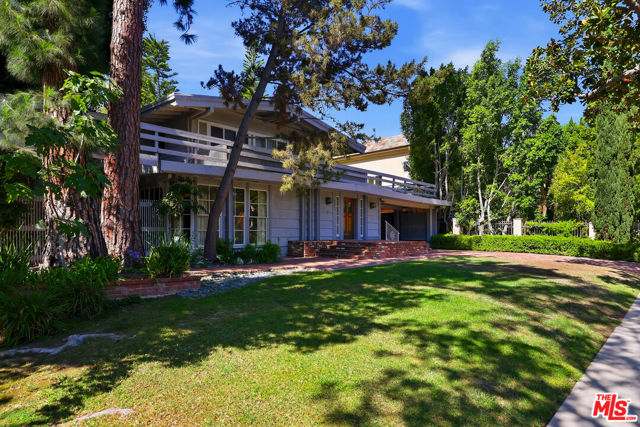
521 North Crescent Drive, Beverly Hills, CA 90210
521 North Crescent Drive, Beverly Hills, CA 90210
Property Description
Developers, investors, and end-users! Welcome to this excellent opportunity to reimagine, redevelop, and rebuild in the sought-after Beverly Hills Flats, with promising upside potential and lasting value! Construct a modern-day dream home in one of the most iconic and desirable locations near the high-end fashion of Rodeo Drive and the Golden Triangle. On the property, there is currently an existing guest house and a main residence. Enjoy premium city services, parks, and schools, all just moments to the area's fine dining, entertainment, nightlife, and more!
Features & Amenities
Property Details
Mortgage Calculator
Current Rates
Comparative Market Analysis
Luxury Tier · 5 active · 5 closed
Beverly Hills · Single Family Residence
Listed 3.4% above the median closed sale of $6,765,000. Luxury tier — fewer comparable sales widen the confidence range.
Price Position
Aligned with the market — fair pricing for the comps.
Active Properties (5)
Active Comparables
| Address | City | Year | BD | BTH | SqFt | LotSz | LP/SqFt | LP | DIM | Score |
|---|---|---|---|---|---|---|---|---|---|---|
| 513 Rexford Drive | Beverly Hills | 1924 | 4 | 3 | 2,876 | 12,430 | $2,258 | $6.50M | 93 | 79 |
| 515 Roxbury Drive | Beverly Hills | 1971 | 3 | 3 | 3,563 | 11,190 | $2,039 | $7.26M | 44 | 71 |
| 505 Roxbury Drive | Beverly Hills | 1924 | 4 | 3 | 2,462 | 11,262 | $2,679 | $6.59M | 187 | 70 |
| 258 Mccarty Drive | Beverly Hills | 1933 | 4 | 5 | 3,390 | 7,655 | $1,916 | $6.50M | 10 | 69 |
| 291 Loring Avenue | Los Angeles | 1948 | 5 | 5 | 4,711 | 14,745 | $1,327 | $6.25M | 44 | 64 |
| Total: 5 · Average | 4.0 | 3.8 | 3,400.4 | 11,456.4 | $2,043.8 | $6.62M | 75.6 | |||
| Median | 3,390 | $6.50M | ||||||||
Closed Properties (5)
Closed Comparables
| Address | City | Year | Date | BD | BTH | SqFt | LotSz | LP | SP | SP/SqFt | SP/LP | DIM | Score |
|---|---|---|---|---|---|---|---|---|---|---|---|---|---|
| 521 Rexford Drive | Beverly Hills | 1922 | 10/01/2026 | 4 | 5 | 3,244 | 13,693 | $7.00M | $7.00M | $2,158 | 1.00 | 36 | 85 |
| 502 Palm Drive | Beverly Hills | 1929 | 06/29/2026 | 5 | 5 | 4,115 | 12,378 | $6.50M | $6.58M | $1,599 | 1.01 | 128 | 76 |
| 238 McCarty Drive | Beverly Hills | 1935 | 08/31/2026 | 4 | 5 | 3,747 | 7,652 | $5.50M | $6.00M | $1,600 | 1.09 | 45 | 74 |
| 512 Elm Drive | Beverly Hills | 1925 | 06/24/2026 | 4 | 3 | 2,526 | 11,513 | $7.29M | $6.76M | $2,678 | 0.93 | 125 | 72 |
| 329 Roxbury Drive | Beverly Hills | 1929 | 08/26/2026 | 5 | 6 | 4,466 | 7,649 | $7.89M | $7.60M | $1,702 | 0.96 | 141 | 72 |
| Total: 5 · Average | 4.4 | 4.8 | 3,619.6 | 10,577 | $6.79M | $6.79M | $1,947.4 | — | 95 | ||||
| Median | 3,747 | $6.76M | $6.76M | ||||||||||
Market Analysis
List vs Sale $/SqFt
Sale Price Trend
Days on Market
Sale vs List Price
This analysis was generated automatically from MLS data. For an in-depth, human-reviewed valuation, contact Joseph Sardella at josephsardella@gmail.com.