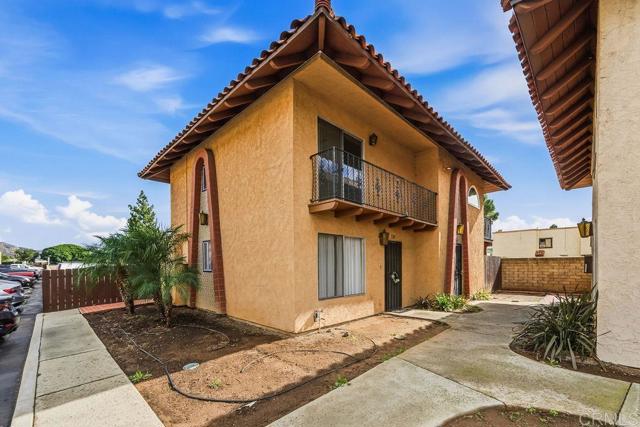
520 South Anza Street, El Cajon, CA 92020
520 South Anza Street, El Cajon, CA 92020
Property Description
Well-maintained 2-bedroom, 1.5-bath townhome located in a quiet El Cajon gated community. This light and bright end unit features tile flooring throughout the downstairs and carpet upstairs, central heating and air conditioning, and in-unit laundry room with washer and dryer. The spacious living area flows into the dining space and kitchen, which is equipped with stainless steel appliances, including a refrigerator, range/oven and wine refrigerator. Both bedrooms are located upstairs with a shared full bathroom, while a convenient half bath is located on the main level. Enjoy outdoor living in the private, gated patio with low-maintenance turf, ideal for relaxing or entertaining. Assigned parking included. HOA covers water, trash, and common area maintenance. Conveniently located near shopping, dining, and freeway access an excellent opportunity for first-time buyers or investors.
Features & Amenities
Property Details
Mortgage Calculator
Current Rates
Comparative Market Analysis
Affordable Tier · 2 active · 1 closed
El Cajon · Townhouse
Listed in line with the median closed sale of $365,000. Closed comps sold at 94% of list — buyers have negotiating leverage.
Price Position
Aligned with the market — fair pricing for the comps.
Active Properties (2)
Active Comparables
| Address | City | Year | BD | BTH | SqFt | LotSz | LP/SqFt | LP | DIM | Score |
|---|---|---|---|---|---|---|---|---|---|---|
| 983 Amistad Place | El Cajon | 1973 | 2 | 1 | 945 | 0 | $421 | $398,000 | 110 | 78 |
| 5931 Howell Drive | La Mesa | 1974 | 1 | 1 | 576 | 2 | $642 | $369,999 | 80 | 56 |
| Total: 2 · Average | 1.5 | 1.0 | 760.5 | 2 | $531.5 | $383,999.5 | 95 | |||
| Median | 945 | $398,000 | ||||||||
Closed Properties (1)
Closed Comparables
| Address | City | Year | Date | BD | BTH | SqFt | LotSz | LP | SP | SP/SqFt | SP/LP | DIM | Score |
|---|---|---|---|---|---|---|---|---|---|---|---|---|---|
| 1719 Pepper Dr. | El Cajon | 1981 | 04/29/2026 | 2 | 2 | 953 | 0 | $389,000 | $365,000 | $383 | 0.94 | 61 | 72 |
| Total: 1 · Average | 2.0 | 2.0 | 953 | 0 | $365,000 | $365,000 | $383 | — | 61 | ||||
| Median | 953 | $365,000 | $365,000 | ||||||||||
Market Analysis
List vs Sale $/SqFt
Sale Price Trend
Days on Market
Sale vs List Price
This analysis was generated automatically from MLS data. For an in-depth, human-reviewed valuation, contact Joseph Sardella at josephsardella@gmail.com.