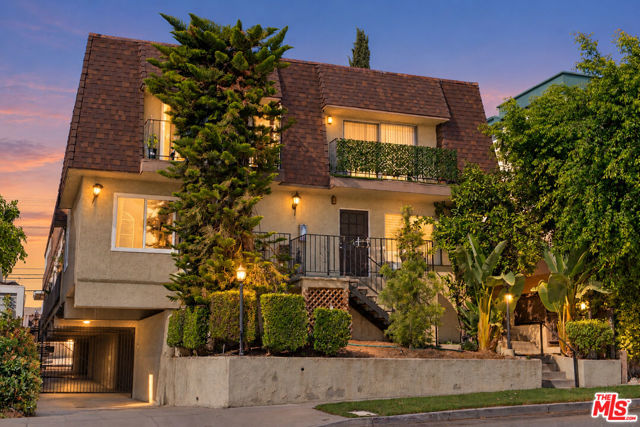
519 East Providencia Avenue, D, Burbank, CA 91501
519 East Providencia Avenue, D, Burbank, CA 91501
Property Description
Ideally located in the heart of Burbank, this light-filled, two-bedroom, two-bathroom residence offers over 1,100 square feet of thoughtfully designed living space. Spanning two levels, the functional floor plan features spacious living areas, multiple private balconies, and the convenience of an in-unit washer and dryer. Situated within a quiet, secure building with low HOA dues, this residence presents an exceptional opportunity for any home buyer. An outstanding value in a highly desirable Burbank location.
Features & Amenities
Property Details
Mortgage Calculator
Current Rates
Comparative Market Analysis
Affordable Tier · 5 active · 5 closed
Burbank · Condominium
Listed 7.0% below the median closed sale of $645,000.
Price Position
Priced below the market — value advantage over the field.
Active Properties (5)
Active Comparables
| Address | City | Year | BD | BTH | SqFt | LotSz | LP/SqFt | LP | DIM | Score |
|---|---|---|---|---|---|---|---|---|---|---|
| 1013 Allen | Glendale | 1979 | 3 | 2 | 1,097 | 7,442 | $577 | $633,000 | 109 | 84 |
| 525 Shelton Street | Burbank | 1977 | 2 | 2 | 1,021 | 20,012 | $539 | $550,000 | 116 | 76 |
| 441 San Jose | Burbank | 1981 | 3 | 2 | 1,362 | 28,230 | $474 | $645,000 | 72 | 75 |
| 365 Alameda | Burbank | 1981 | 2 | 2 | 1,250 | 22,131 | $438 | $548,000 | 66 | 73 |
| 1340 Glenwood Road | Glendale | 1985 | 2 | 3 | 1,250 | 0 | $440 | $549,900 | 226 | 72 |
| Total: 5 · Average | 2.4 | 2.2 | 1,196 | 19,453.75 | $493.6 | $585,180 | 117.8 | |||
| Median | 1,250 | $550,000 | ||||||||
Closed Properties (5)
Closed Comparables
| Address | City | Year | Date | BD | BTH | SqFt | LotSz | LP | SP | SP/SqFt | SP/LP | DIM | Score |
|---|---|---|---|---|---|---|---|---|---|---|---|---|---|
| 1015 Spazier Avenue | Burbank | 1990 | 10/09/2026 | 3 | 2 | 1,130 | 8,392 | $659,000 | $645,000 | $571 | 0.98 | 119 | 85 |
| 326 Valencia | Burbank | 1980 | 04/22/2026 | 2 | 3 | 1,170 | 7,649 | $679,000 | $679,000 | $580 | 1.00 | 72 | 85 |
| 557 Verdugo Avenue | Burbank | 1980 | 08/18/2026 | 2 | 3 | 1,229 | 15,065 | $660,000 | $665,000 | $541 | 1.01 | 69 | 82 |
| 601 Orange Grove | Burbank | 1969 | 01/20/2026 | 2 | 2 | 925 | 0 | $580,000 | $565,000 | $611 | 0.97 | 90 | 81 |
| 436 Palm Avenue | Burbank | 1980 | 05/11/2026 | 2 | 2 | 1,016 | 34,092 | $659,000 | $640,000 | $630 | 0.97 | 83 | 81 |
| Total: 5 · Average | 2.2 | 2.4 | 1,094 | 16,299.5 | $638,800 | $638,800 | $586.6 | — | 86.6 | ||||
| Median | 1,130 | $645,000 | $645,000 | ||||||||||
Market Analysis
List vs Sale $/SqFt
Sale Price Trend
Days on Market
Sale vs List Price
This analysis was generated automatically from MLS data. For an in-depth, human-reviewed valuation, contact Joseph Sardella at josephsardella@gmail.com.